
Auxiliary Power Supply System with Parallel-Connected DC–AC Inverters for Low-Floor Light Rail Vehicle

1
Department of Electrical Engineering, Faculty of Engineering, Rajamangala University of Technology Isan, Khon Kaen Campus, Khon Kaen 40000, Thailand
2
Department of Electrical Engineering, School of Engineering, King Mongkut’s Institute of Technology Ladkrabang, Bangkok 10520, Thailand
*
Author to whom correspondence should be addressed.
Electronics 2023, 12(14), 3117; https://doi.org/10.3390/electronics12143117
Submission received: 29 April 2023
/
Revised: 8 July 2023
/
Accepted: 10 July 2023
/
Published: 18 July 2023
(This article belongs to the Section Power Electronics)
Abstract
:This research proposes a roof-mounted auxiliary power supply (APS) system for 600 VDC low-floor light rail vehicles (LRVs). The proposed APS system consists of five parallel-connected dc–ac inverter modules (modules 1–5). Inverter modules 1 and 2 are three-phase dc–ac inverters for the compressor motors of the air conditioning system, and inverter modules 3 and 4 are three-phase dc–ac inverters for the air pump motors of the air supply system. Inverter module 5 is a single-phase dc–ac inverter for the 220 VAC power supply of onboard electric loads. Simulations and experiments were carried out under variable load torques and output frequencies for modules 1–4 and under full and no resistive loads for module 5. The measured total input current and total input power of the proposed APS system under the full-load condition are 114.36 A and 68.84 kW. The total efficiency of the proposed APS system (modules 1–5) is 97.05%. The proposed APS system is suitable for 600 VDC low-floor LRVs. The novelty of this research lies in the use of five parallel-connected inverter modules, as opposed to the three-phase output transformer or isolated dc–dc converter in the early and conventional APS systems. Specifically, the proposed APS system requires neither a three-phase output transformer nor an isolated dc–dc converter.
1. Introduction
To combat urban traffic congestion and air pollution, cities around the world invest in public transportation, such as tramways [1,2], light rail vehicles [3,4], metros [5,6,7], and subways [8]. Light rail vehicle (LRV) is a type of dc train suitable for passenger transportation in less-densely populated urban areas (i.e., second- or third-tier cities).
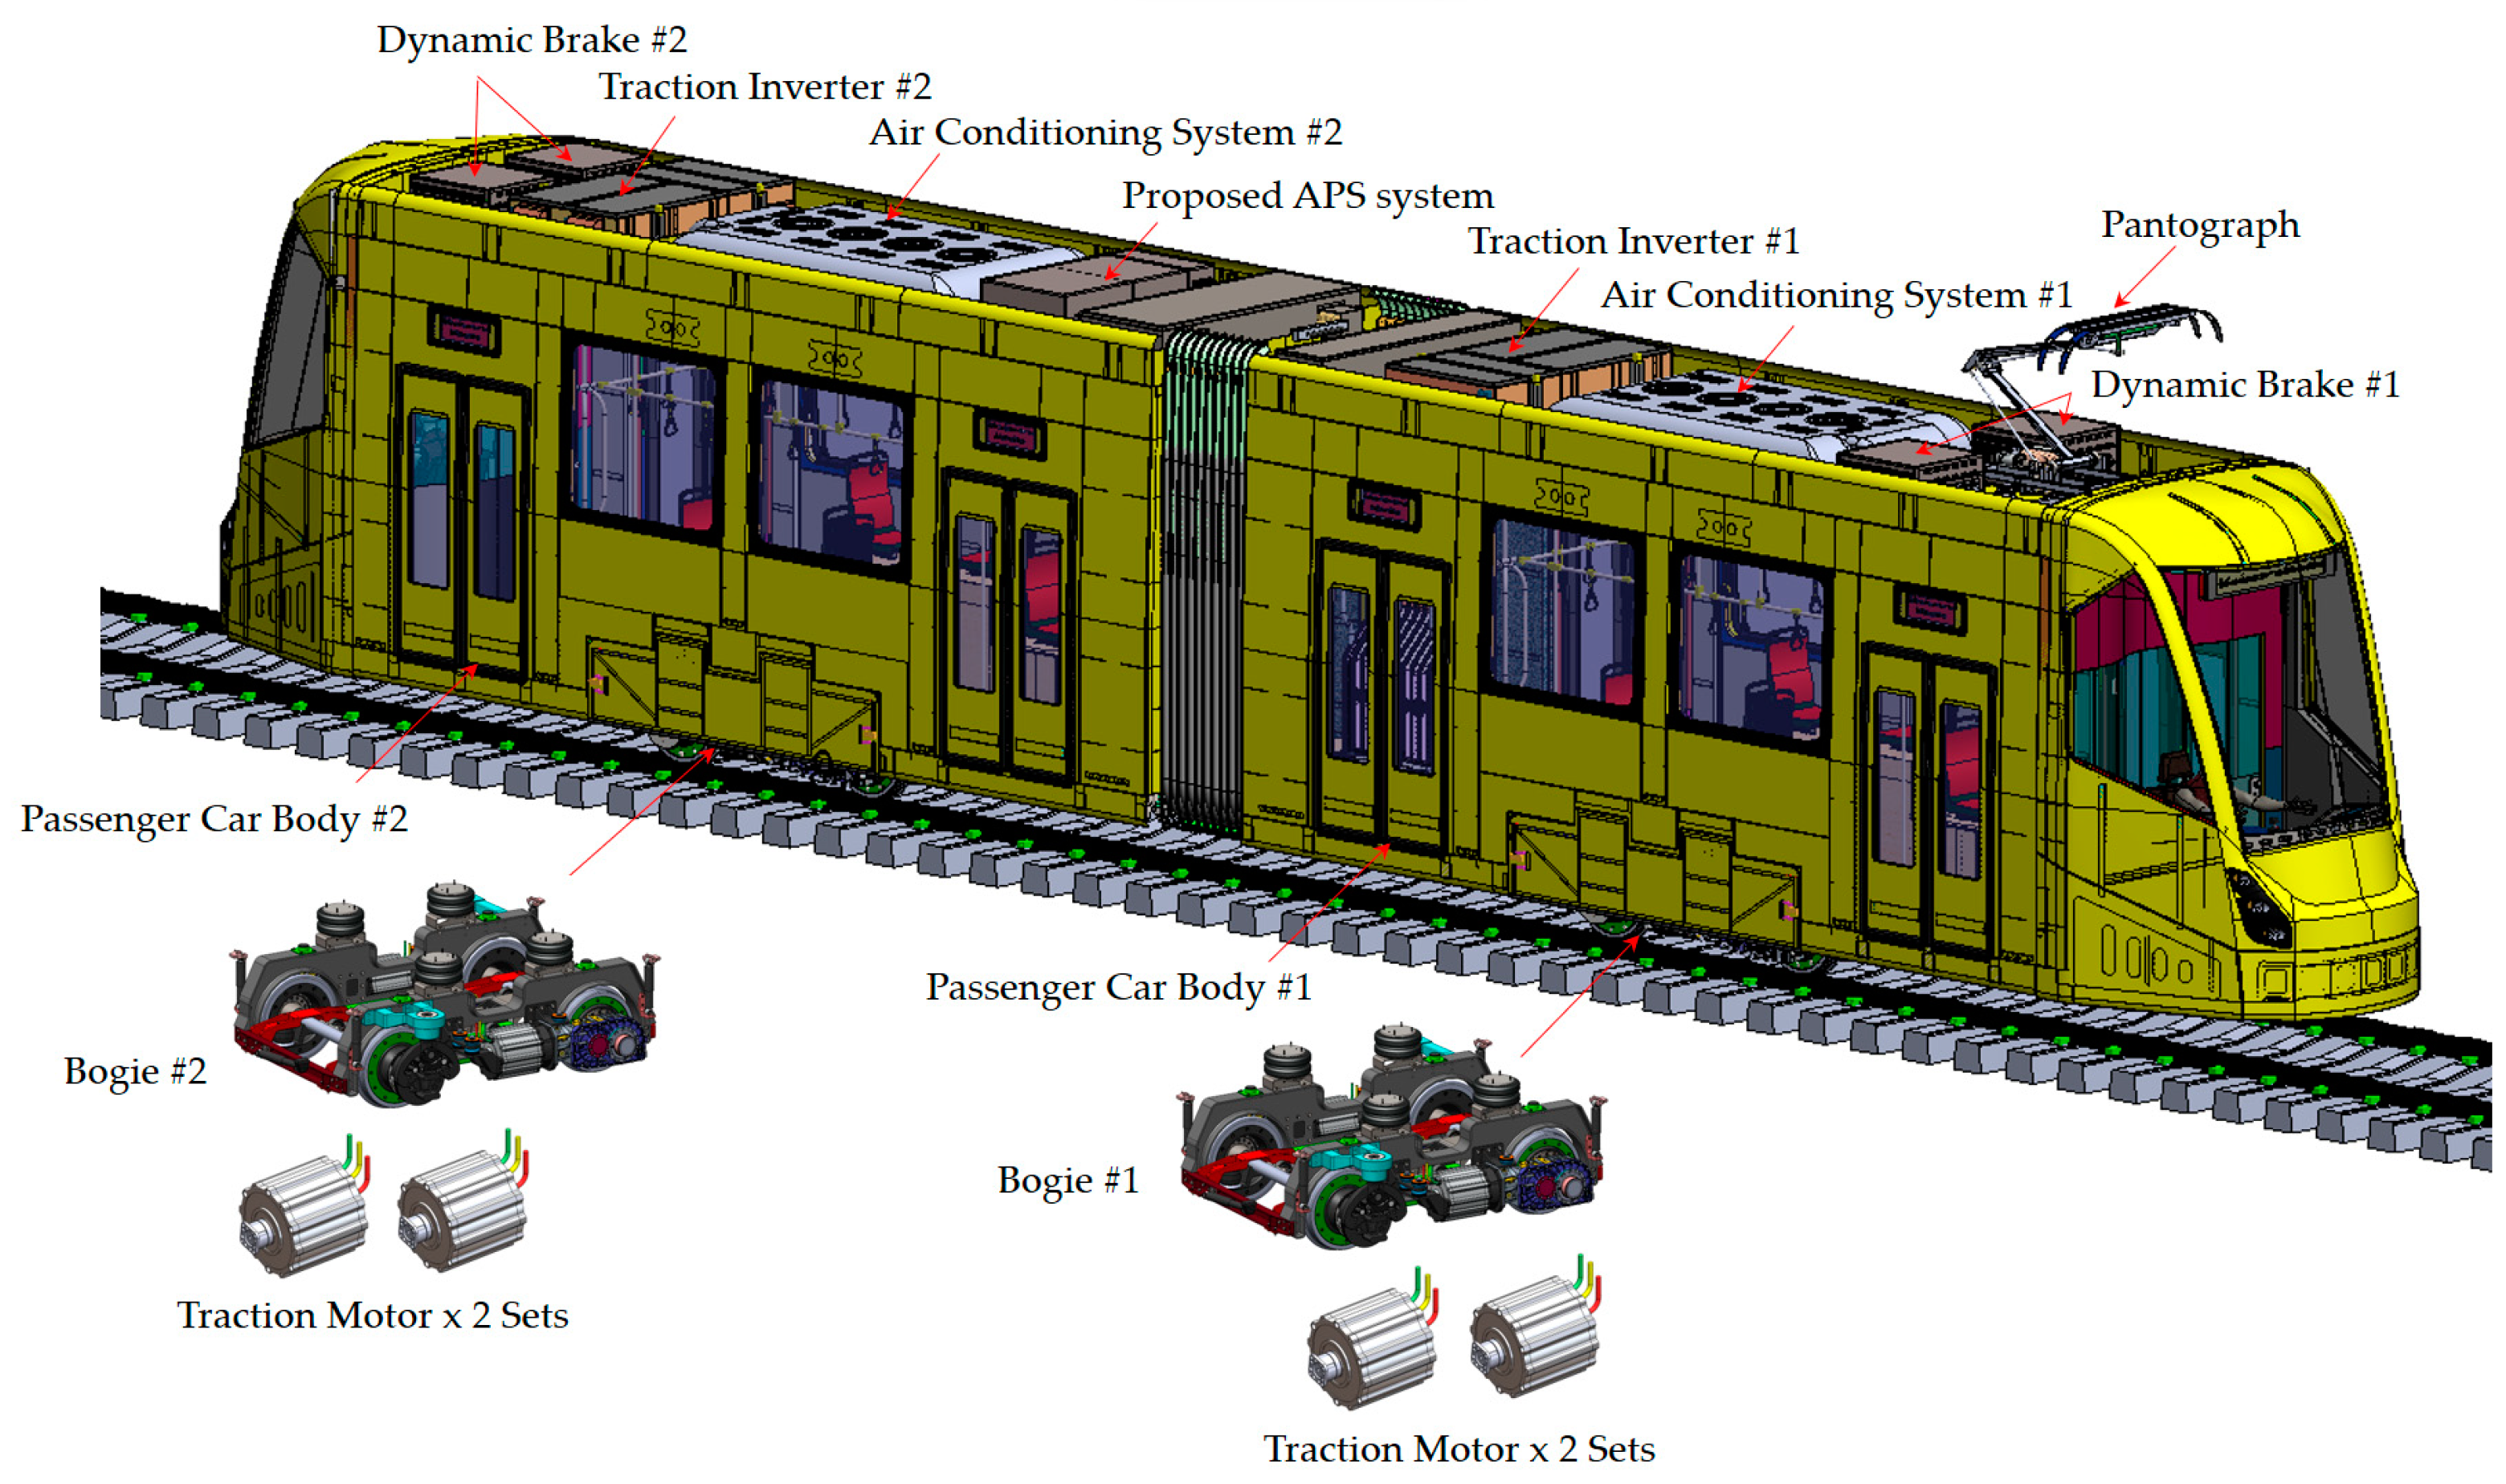
In the propulsion system of LRVs, the main components include the bogie, passenger car body, traction motor, traction inverter, traction control, pantograph, braking system, and signaling system. There are also onboard components for train passenger comfort, such as the air conditioning system, passenger information system, electric doors, auxiliary power supply system, and air suspension.
The onboard electric system of a dc train comprises the electric traction system and auxiliary power supply (APS) system. The electric traction system consists of traction inverter, traction motor, and traction control system. It converts the dc voltage received from the overhead contact line or third rail system into optimal voltage for the traction motor for the driving gear transmission and wheel sets on the bogie of the dc train. The APS system converts the dc voltage received from the overhead contact line or third rail system into voltage levels suitable for the onboard electric loads such as the compressors of the air conditioning system, fans, air pumps, lighting, electric doors, control system, and battery charging system.
Different APS systems have been proposed for dc trains [9,10,11,12,13,14,15,16,17,18,19,20,21,22,23,24]. The input voltage of the APS system received from the overhead contact line or third rail system typically is between 600–3000 VDC [25]. The output voltages of the APS system are three-phase AC, single-phase AC, and 110 VDC or 24 VDC. The three-phase output voltages of the APS system are either constant-voltage–constant-frequency (CVCF) at 400 VAC 50 Hz/60 Hz or variable-voltage–variable-frequency (VVVF) at 0–400 VAC 0–50 Hz/0–60 Hz, depending on the specifications of the onboard electric loads.
For safety reasons, the input side and output side of the APS system of dc trains are isolated. In the early APS system, the input and output are isolated by a low-frequency transformer, as shown in Figure 1. The advantage of the early APS system is its pure sinusoidal output waveform. However, the early APS system suffers from heavy weight and bulkiness. As a result, the technology is limited to underfloor installation in metro trains and subways.
To reduce its size and weight, the low-frequency transformer is replaced with an isolated dc–dc converter as in the conventional APS system, as shown in Figure 2. The advantage of the conventional APS system is that it can be installed on the rooftop of low-floor LRVs due to the light weight. However, the dc–dc converter is difficult to design and control for high power. In addition, in the case of a faulty dc–dc converter, the electric traction system and the APS system will stop functioning, resulting in disruptions in the train service.
In modern dc trains, the output of the APS system consists of VVVF and CVCF. VVVF is used to control the compressor motors of the air conditioning system and the air pump motors of the air supply system. CVCF is used for other onboard electric loads such as lighting, fans, electric doors. However, the output voltage of the conventional APS system is limited to CVCF. As a result, it is necessary to redesign the APS system so that it can achieve both VVVF and CVCF output voltage to meet the onboard electric load requirements of dc trains.
Previous research on the dc–ac inverters has focused on the electric traction system [26,27,28,29,30,31], electric vehicles [32,33], microgrid power system [34,35], and home electrical appliances [36,37]. There are various topologies of dc–ac inverters, including two-level, three-level, and multilevel topologies, depending on the voltage, current, and power requirements.
In [26], the researchers reviewed the electric traction systems of LRVs and proposed a new hybrid electric traction system for LRVs. In [27], a three-phase two-level dc–ac inverter using all-silicon carbide (SiC) power semiconductors was proposed in the design and development of a high-performance 165 kVA traction system for light rail transportation. The experimental power semiconductors included SiC-MOSFET, Si-IGBT, and Hybrid IGBT, and the efficiency of the dc–ac inverters with the SiC-MOSFET, Si-IGBT and Hybrid IGBT semiconductors was compared. In [28], a three-phase two-level 750 VDC 100 kW permanent-magnet synchronous motor (PMSM)-based dc–ac inverter was proposed for the traction system of dc trains. In [29], a three-phase six-level dc–ac inverter was developed and used in the traction system of dc trains. The input and output voltages of the three-phase six-level dc–ac inverter were 1500 VDC and 700 VAC, with an output power of 400 kW and an efficiency of 98.5%. In [30], a double three-level active neutral-point-clamped (ANPC) bridge topology for the high-output-frequency multilevel dc–ac inverter was proposed for the traction system of superspeed maglev trains. The proposed double three-level ANPC bridge topology improved the output voltage, current, and frequency of the traction system. In [31], a three-phase two-level dc–ac inverter with multiple on-line open-circuit fault diagnostics was proposed to control the railway air conditioning inverters. The proposed inverter achieved an input voltage, output voltage, and output frequency of 600 VDC, 380 VAC, and 50 Hz.
In [32], the researchers systematically reviewed publications on the two-level dc–ac inverter topology of current electric vehicles (EVs) and the multilevel dc–ac inverter topologies for future EVs. The advantages of the multilevel dc–ac inverters over the two-level dc–ac inverters include lower current, higher power density, and shorter charging time of the battery. In [33], a two-level three-phase dc–ac inverter with PID vector control was proposed to control the speed of the air conditioning compressor on electric buses.
In [34], a five-level dc–ac inverter with a dc–dc converter and the cyber-physical power system (CPPS)-based hybrid power system optimization scheme was proposed for microgrid power systems. The proposed technology achieved four levels of output voltage. In [35], a double multilevel converter with adjustable output voltages was proposed for microgrid power systems. The proposed double multilevel converter consists of a dc–dc multilevel boost converter and a multilevel dc–ac inverter. The proposed double multilevel converter achieved four output voltage levels, with a load current of 7 A. The input voltage of the dc–dc boost converter is 40 V, and the output voltage of multilevel dc–ac inverter is 400 V. In [36,37], the dc–ac inverter was used to control household pump motors. However, no research exists on the application of dc–ac inverters in the APS system to control the air conditioning compressor motors and pump motors of dc trains.
As a result, this research proposes a roof-mounted APS system for 600 VDC low-floor light rail vehicles. The proposed APS system consists of five parallel-connected inverter modules (modules 1–5), as shown in Figure 3. Inverter modules 1 and 2 are three-phase dc–ac inverters for the compressor motors of the air conditioning system, and modules 3 and 4 are three-phase dc–ac inverters for the air pump motors of the air supply system. Inverter module 5 is single-phase dc–ac inverter for the 220 VAC 50 Hz power supply of onboard electric loads. The proposed APS system uses five parallel-connected inverter modules in place of the three-phase output transformer (of the early APS system) and isolated dc–dc converter (of the conventional APS system). Simulations and experiments were carried out under variable load torques (25–100%) and output frequencies (10–50 Hz) for modules 1–4 and under full resistive load and no resistive load for module 5. The performance metrics are the total input current and total input power of the proposed APS system (modules 1–5) under full-load condition.
The organization of this research is as follows: Section 1 is the introduction. Section 2 deals with the design of the low-floor LRV and onboard electric loads. Section 3 details the development of the proposed APS system for the low-floor LRV. Section 4 discusses the simulation and experimental results of the proposed APS system. The concluding remarks are provided in Section 5.
2. Low-Floor Light Rail Vehicle
2.1. Design of Low-Floor Light Rail Vehicle
Figure 4 shows the design of the low-floor LRV, which was locally designed and developed to combat traffic congestion and worsening air pollution in Thailand’s northeastern province of Khon Kaen, which is located 450 km from the capital Bangkok.
As shown in Figure 4, the design of LRV for the Khon Kaen light rail transit project is of the low-floor LRV type with an electric traction system and a roof-mounted APS system. Table 1 presents the specifications of the low-floor LRV, which will be used to design the electric traction system in subsequent research.
Table 2 shows the specifications of the onboard electric loads of the low-floor LRV, including two compressor motors for the air conditioning system, two air pump motors for the air supply system, as well as the lighting, fans, electric doors, and battery charging system. The onboard electric loads receive electrical power from the APS system. The specifications of the onboard electric loads of the low-floor LRV were used to design the proposed APS system. The proposed APS system converts 600 VDC from the overhead contact line to VVVF and CVCF for the onboard electric loads.
In Table 2, the onboard electric loads consist of two air conditioning systems, which require 3-phase 400 VAC 50 Hz electrical power to operate the compressor motors; two air pump systems, which require 3-phase 400 VAC 50 Hz electric power to operate the air pump motors; and other electric loads including fans, lightings, electric doors, and the battery charging system which require 220 VAC 50 Hz. Due to the demand for VVVF and CVCF for onboard electric loads, this research thus proposes an APS system using five parallel-connected dc–ac inverters that supply both VVVF and CVCF outputs for the onboard electric loads of the low-floor LRV. For safety reasons, the high-voltage side of the proposed APS system, the grounding system of the 600 VDC overhead contact line system, the car body, and the bogies of the low-floor LRV are isolated by onboard air suspensions and insulators.
2.2. Overhead Contact System of Low-Floor Light Rail Vehicle
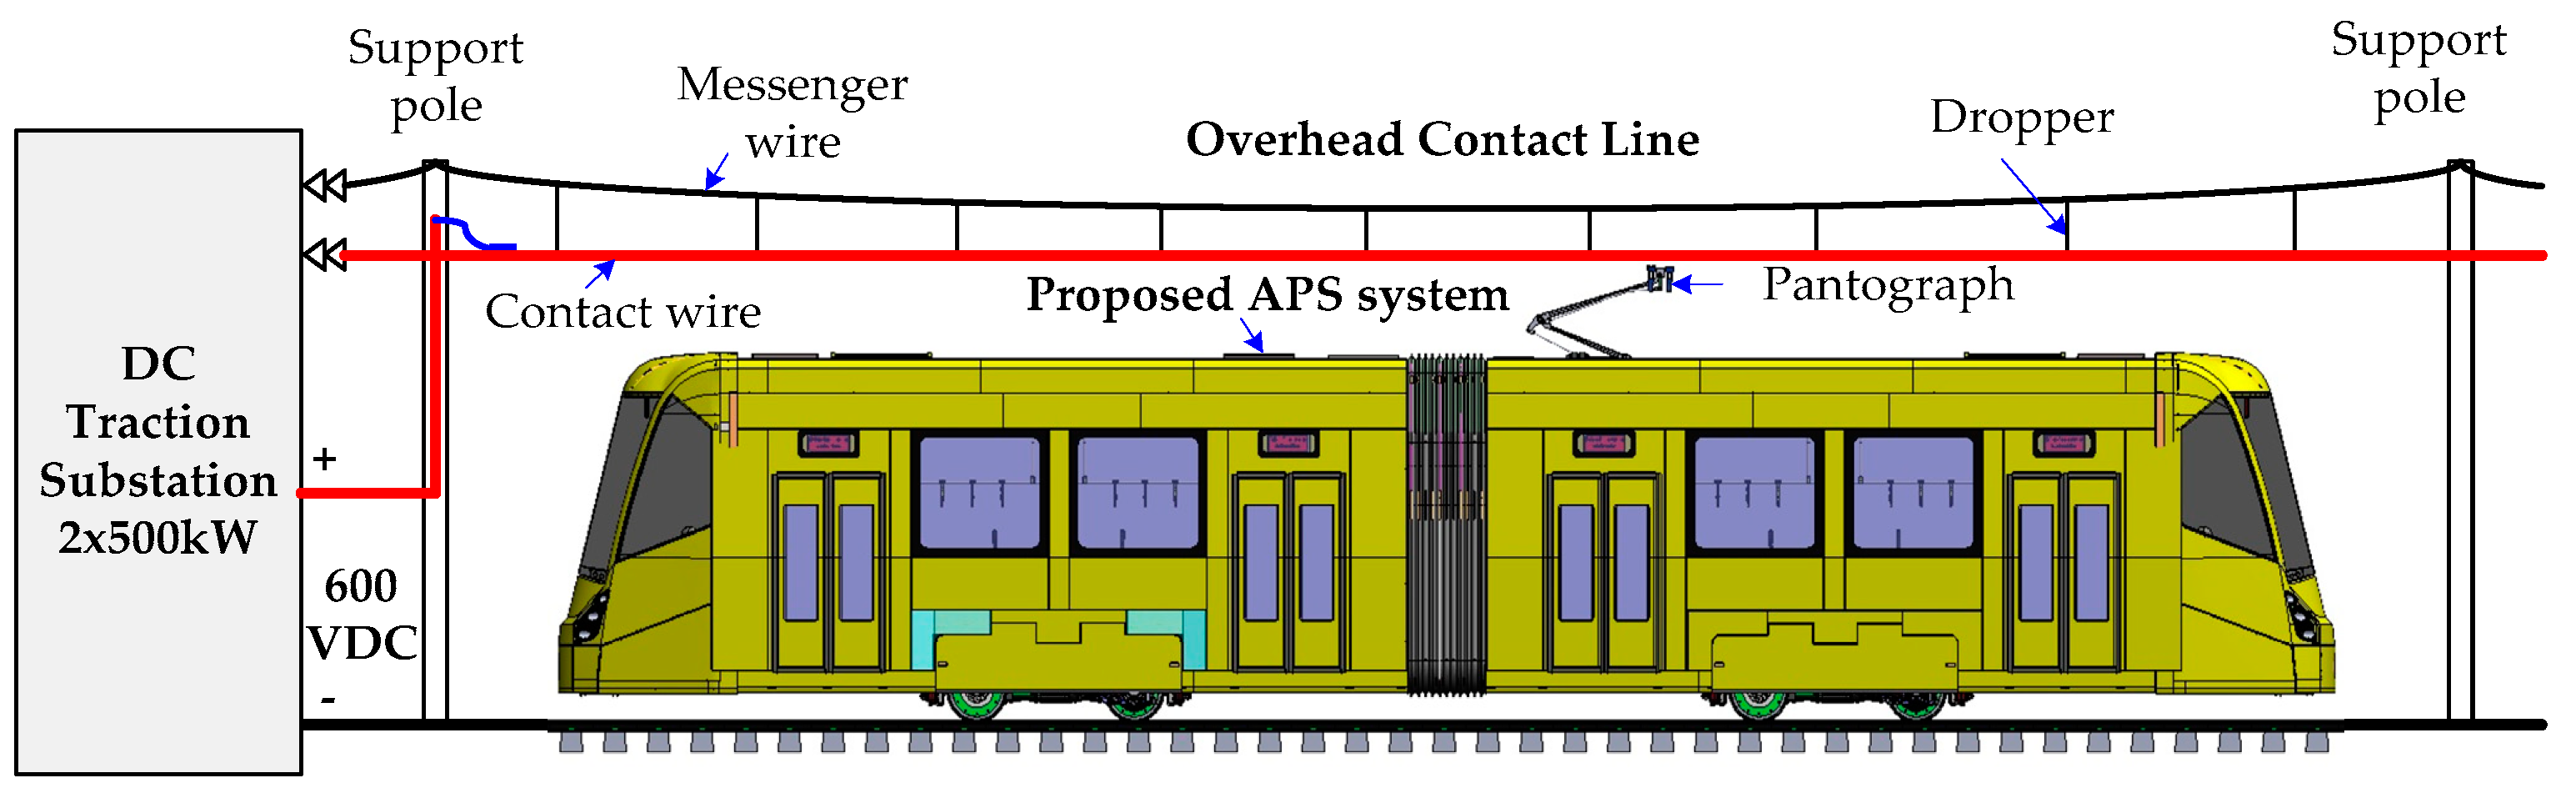
The overhead contact system (OCS) is a power distribution system that delivers power to LRVs from a contact wire. In this research, the OCS of the low-floor LRV includes the overhead contact wire (i.e., the 600 VDC overhead contact line), messenger wire, dropper, support poles, and power feeds from the dc traction substation to the overhead contact wire, as shown in Figure 5. The voltage range and maximum traction power of the dc traction substation are 540–800 VDC and 2 × 500 kW, respectively.
2.3. Connecting Diagram of Roof-Mounted Auxiliary Power Supply System
Figure 6 shows the connecting diagram of the proposed APS system and onboard electric loads between cars no. 1 and 2. The pantograph, lightning arrester (LA), main circuit breaker (MCB), traction inverter #1, and air conditioning system #1 are installed on the rooftop of car no. 1. Traction inverter #2, air conditioning system #2, and the proposed APS system are mounted on the rooftop of car no. 2.
2.4. Power Consumption of Auxiliary Power Supply System in Light Rail Vehicle
The total input power of the APS system () is calculated by multiplying the dc voltage of the overhead contact line () by the total dc input current () and can be mathematically expressed as:
where is the total input power, is the overhead contact line voltage, is the total input current of the APS system, and are the input currents of the dc–ac inverters for the compressor motors no. 1 and 2, and are the input currents of the dc–ac inverters for air pump motors no. 3 and 4, is the input current of the dc–ac inverter for the single-phase power supply, and are the input powers of the dc–ac inverters for compressor motors no. 1 and 2, and are the input powers of the dc–ac inverters for air pump motors no. 3 and 4, and is the input power of the dc–ac inverter for single-phase power supply.
2.5. Efficiency of Auxiliary Power Supply System in Light Rail Vehicle
The efficiency of the proposed APS system is the summation of the proportion of output power to input power of all dc–ac inverters, expressed as percentages. The efficiency of the individual dc–ac inverters and the proposed APS system is calculated by:
where , , , , and are the efficiency of the dc–ac inverter modules 1–5, respectively; and is the total efficiency of the APS system.
2.6. Passenger Room Temperature Control in Light Rail Vehicle
Figure 7 shows the control method of the passenger room temperature of the low-floor LRV. The air conditioning system is turned on at , and the compressor motors start functioning to full load (400 VAC 50 Hz) at the rated speed (1500 rpm). The passenger room temperature continues to decrease until reaching the reference temperature () at . The speed of the compressor motors is reduced to maintain the passenger room temperature at (20 °C) until the end of train operation at .
2.7. Air Pressure Control in the Air Supply System of Light Rail Vehicle
Figure 8 shows the control method of air pressure in the air supply system of the low-floor LRV. The air pump motors are turned on at and the motors start functioning to full load (400 VAC 50 Hz) at the rated speed (1500 rpm). The air pressure continues to increase until reaching the reference pressure () at . The air pump motors stop functioning (from to ) and restart when the air pressure drops below 5 psi to maintain the air pressure at (10 psi) until the end of train operation at .
2.8. Variable Voltage and Variable Frequency Control Method
In this research, the variable-voltage–variable-frequency (VVVF) control method is used to vary the speed of the three-phase compressor motors of the air conditioning system and the three-phase air pump motors of the air supply system. The speed of the compressor motors and the air pump motors are controlled by varying the stator voltage and output frequency. The advantages of the VVVF controller include its low-complexity algorithm and ease of implementation. The relationship between the stator voltage, output frequency, air gap flux, and maximum torque of the induction motor can be mathematically expressed as:
where is the stator voltage, is the number of turns per phase of stator windings, is the stator winding factor, is the air gap flux, is the output frequency, is the ratio of stator voltage to output frequency, and is the maximum torque.
Figure 9 shows the relationship between torque and speed in the VVVF control method. The ratio of stator voltage to output frequency is varied to optimize the torque and speed of the compressor and air pump motors.
3. Development of Auxiliary Power Supply System for Low-Floor Light Rail Vehicle
3.1. Topology of Three-Phase DC–AC Inverter
In this research, the three-phase dc–ac inverters are used to convert the 600 VDC received from the overhead contact line to the voltage and frequency for the onboard electric loads, including the air conditioning compressor motors and the air pump motors.
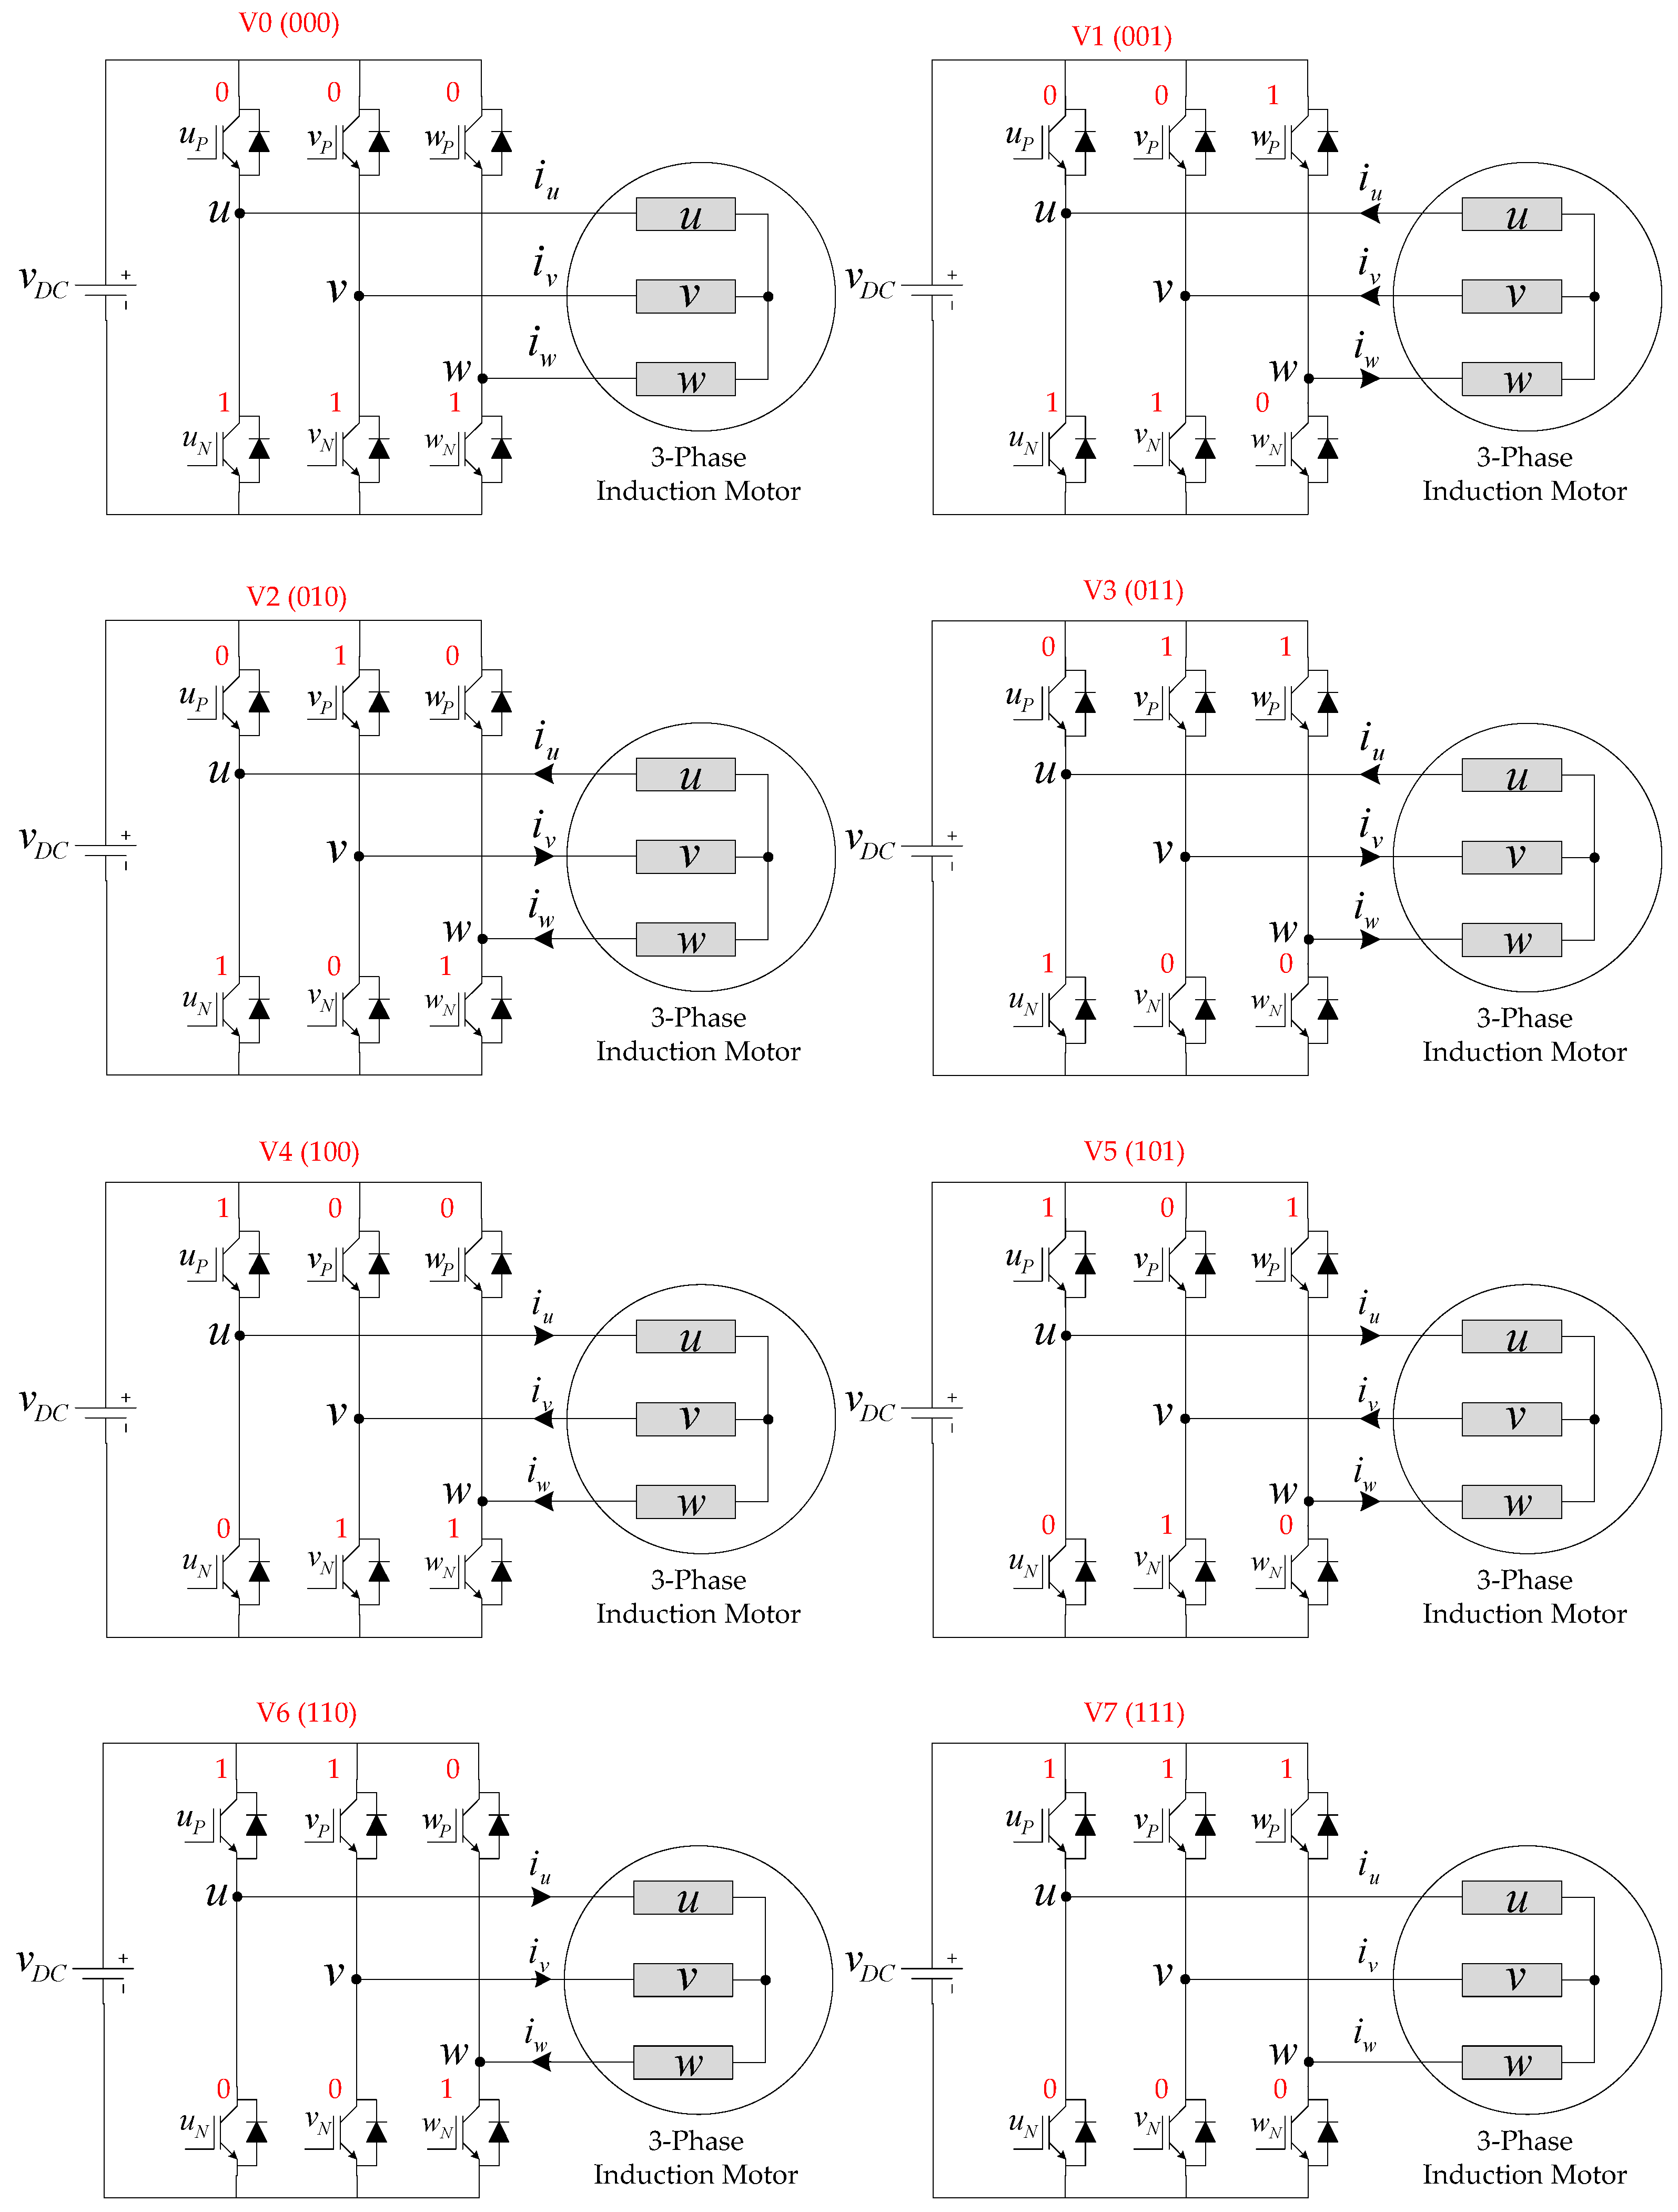
Figure 10 shows the topology of the three-phase two-level dc–ac inverter with six IGBT switches for three legs (, , and ) and the direction of phase current under voltage vector to in space vector pulse width modulation (SVPWM).
At vector switch , the three upper switches , , and are turned off while the three lower switches , , and are turned on, resulting in no current flowing into the motor. At vector switch , the two upper switches , are turned off and the remaining upper switch is turned on, while the lower switches , , and have opposite switching statuses to the upper switches, resulting in the phase currents iu and iv flowing out of the motor and iw flowing into the motor.
At vector switch , the two upper switches and are turned off and the remaining upper switch is turned on, while the lower switches , , and have opposite switching statuses to the upper switches, causing and to flow out of the motor and to flow into the motor.
At vector switch , the two upper switches and are turned on and the remaining upper switch is turned off, while the lower switches , , and have opposite switching statuses to the upper switches, causing and to flow into the motor and to flow out of the motor. At vector switch , the two upper switches and are turned off and the remaining upper switch is turned on, while the lower switches , , and are in opposite switching status to the upper switches, causing and to flow out of the motor and to flow into the motor.
At vector switch , the two upper switches and are turned on and the remaining upper switch is off, while the lower switches , , and are have switching statuses to the upper switches, causing and to flow into the motor and to flow out of the motor.
At vector switch , the two upper switches and are turned on and the remaining upper switch is turned off, while the lower switches , , and have opposite switching statuses to the upper switches, causing and to flow into the motor and to flow out of the motor. At vector switch, the three upper switches , , and are turned on while the lower switches , , and are turned off, resulting in no current flowing into the motor.
The SVPWM technique is used to generate the gate driving signals of the IGBT switches (, , , , , and ) in the three-phase two-level dc–ac inverters for the compressor motors (modules 1 and 2) and the air pump motors (modules 3 and 4).
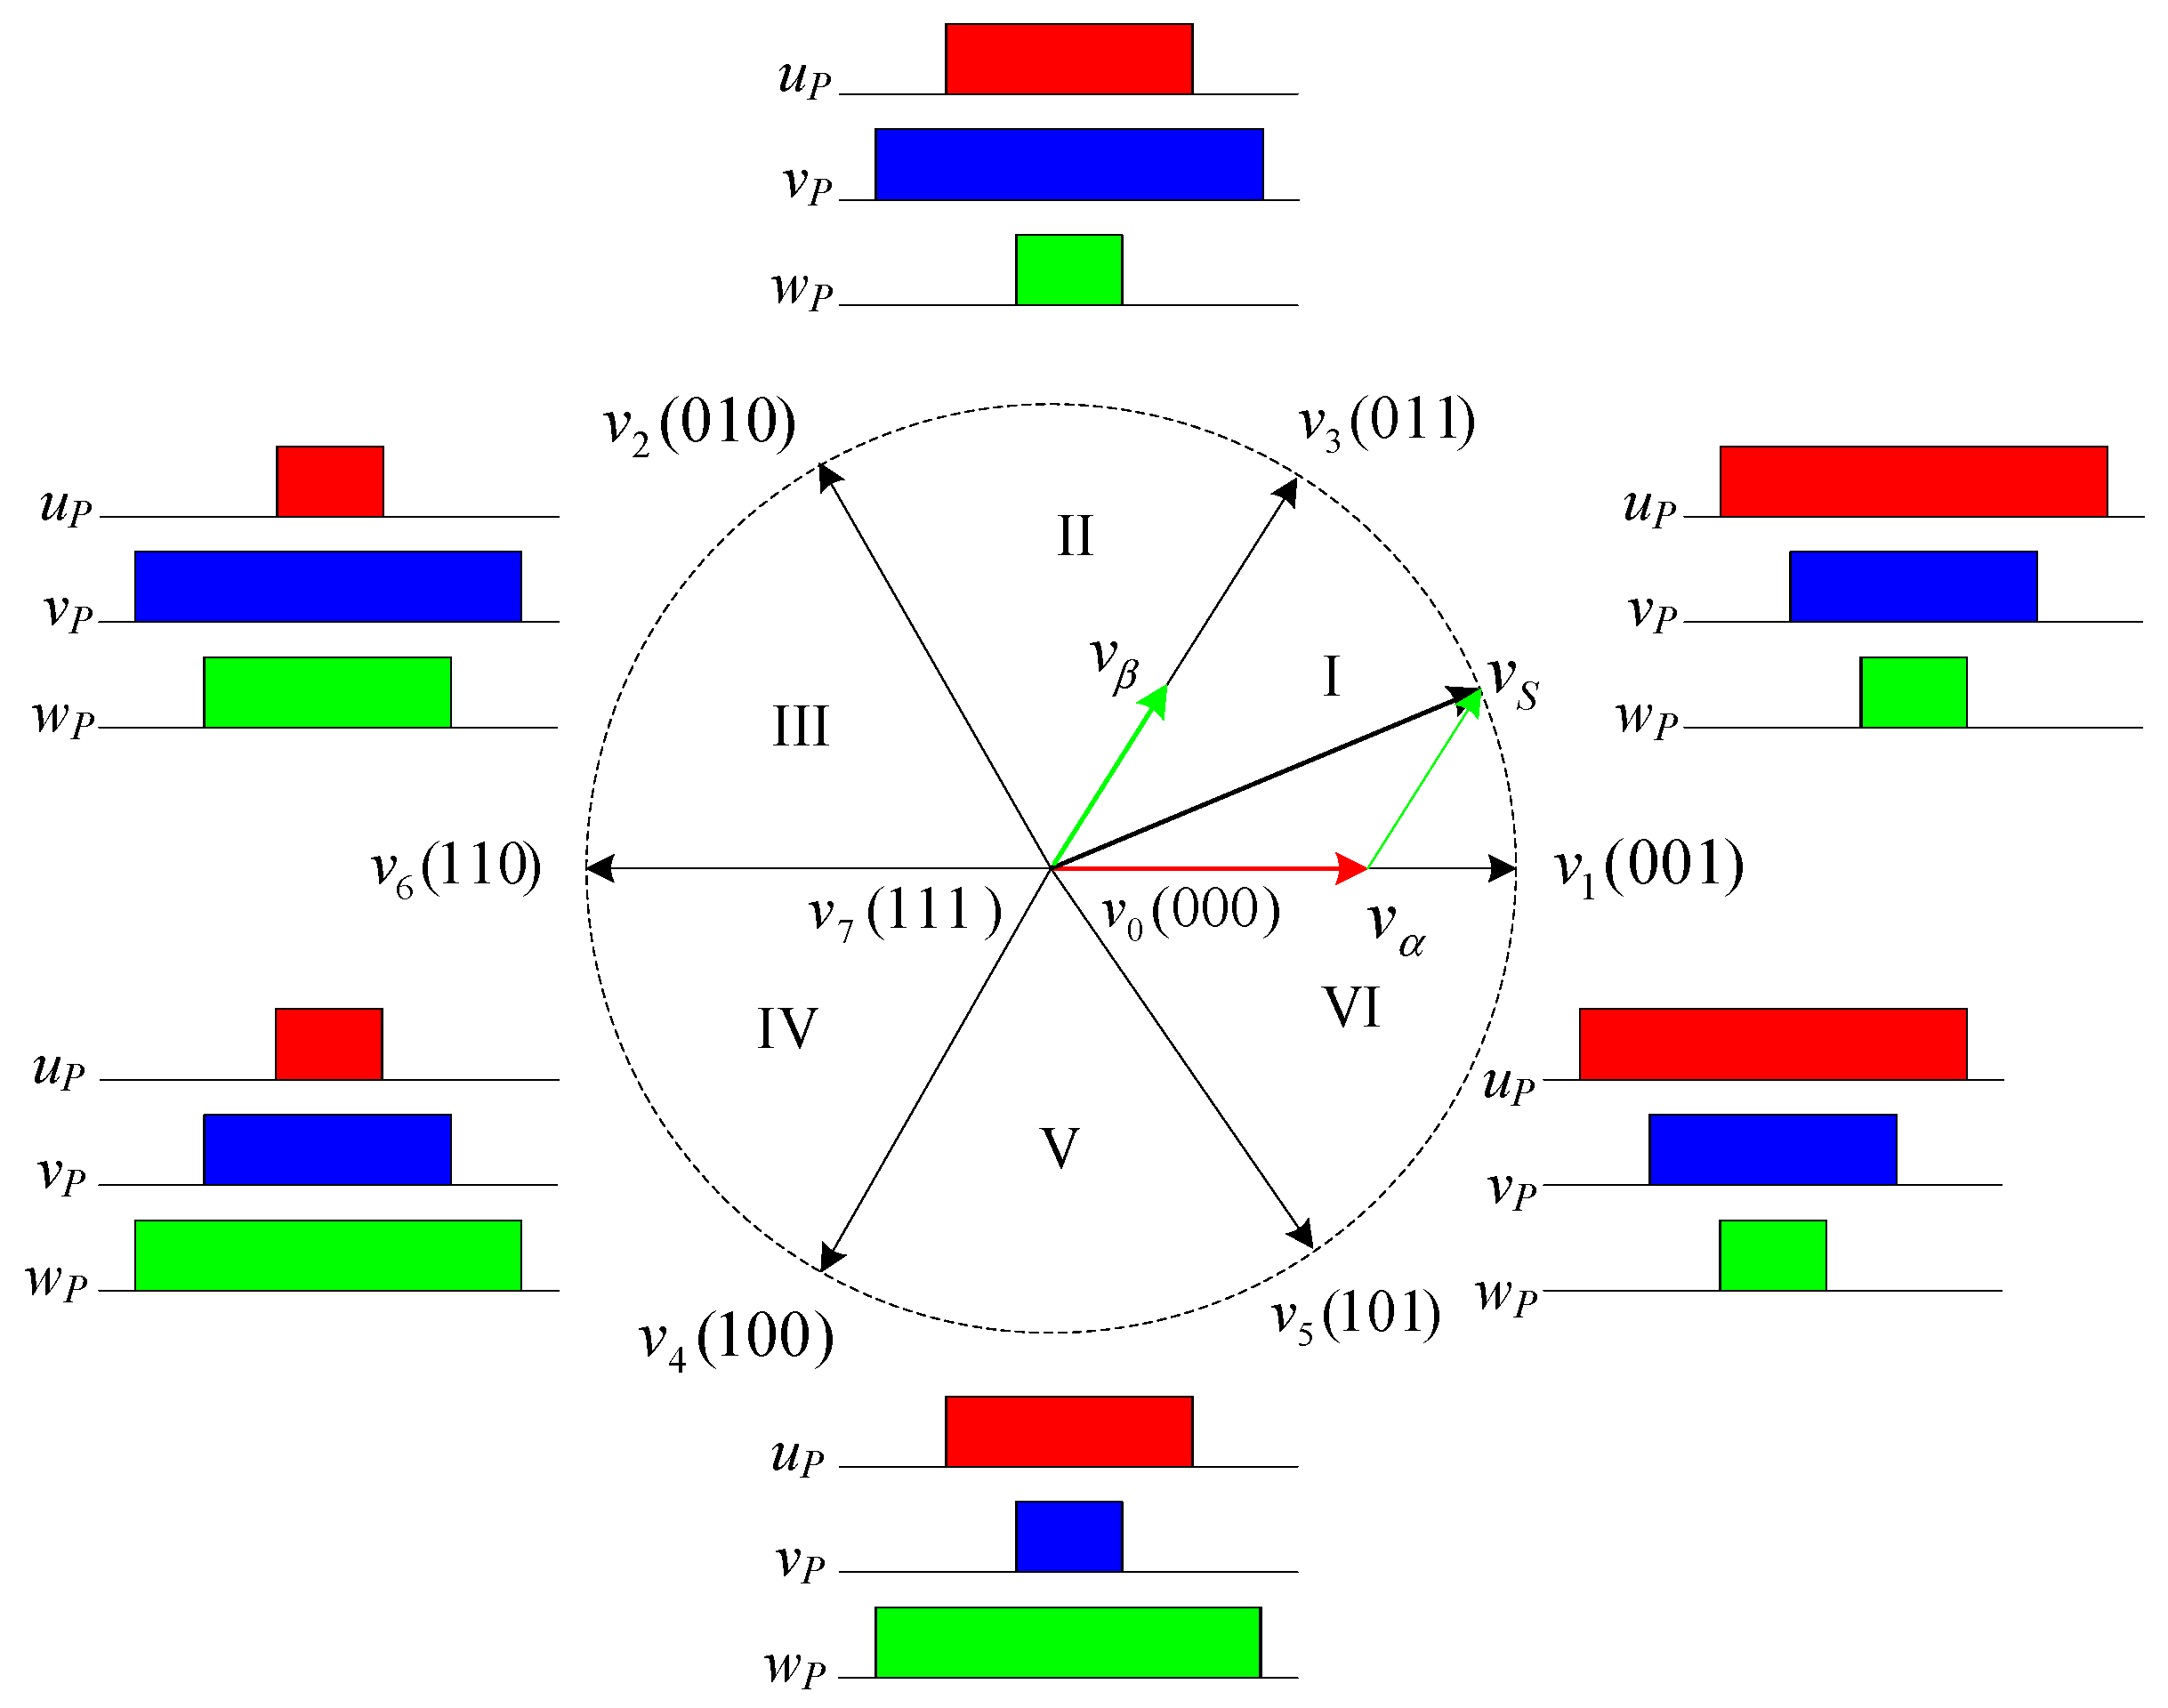
Figure 11 shows eight possible switching vectors for the dc–ac inverters from to with six active switching vectors (–) and two zero vectors ( and ). The voltage vector () in sectors I, II, III, IV, V, and VI rotate from 0°–60°, 61°–120°, 121°–180°, 181°–240°, 241°–300°, and 301°–360°, respectively. Figure 11 also shows the status of upper IGBT switches , , and for the three legs (, , ) using SVPWM. The statuses of the lower IGBT switches , , and are the opposite of those of the upper IGBT switches.
3.2. Development of Three-Phase DC–AC Inverter Modules
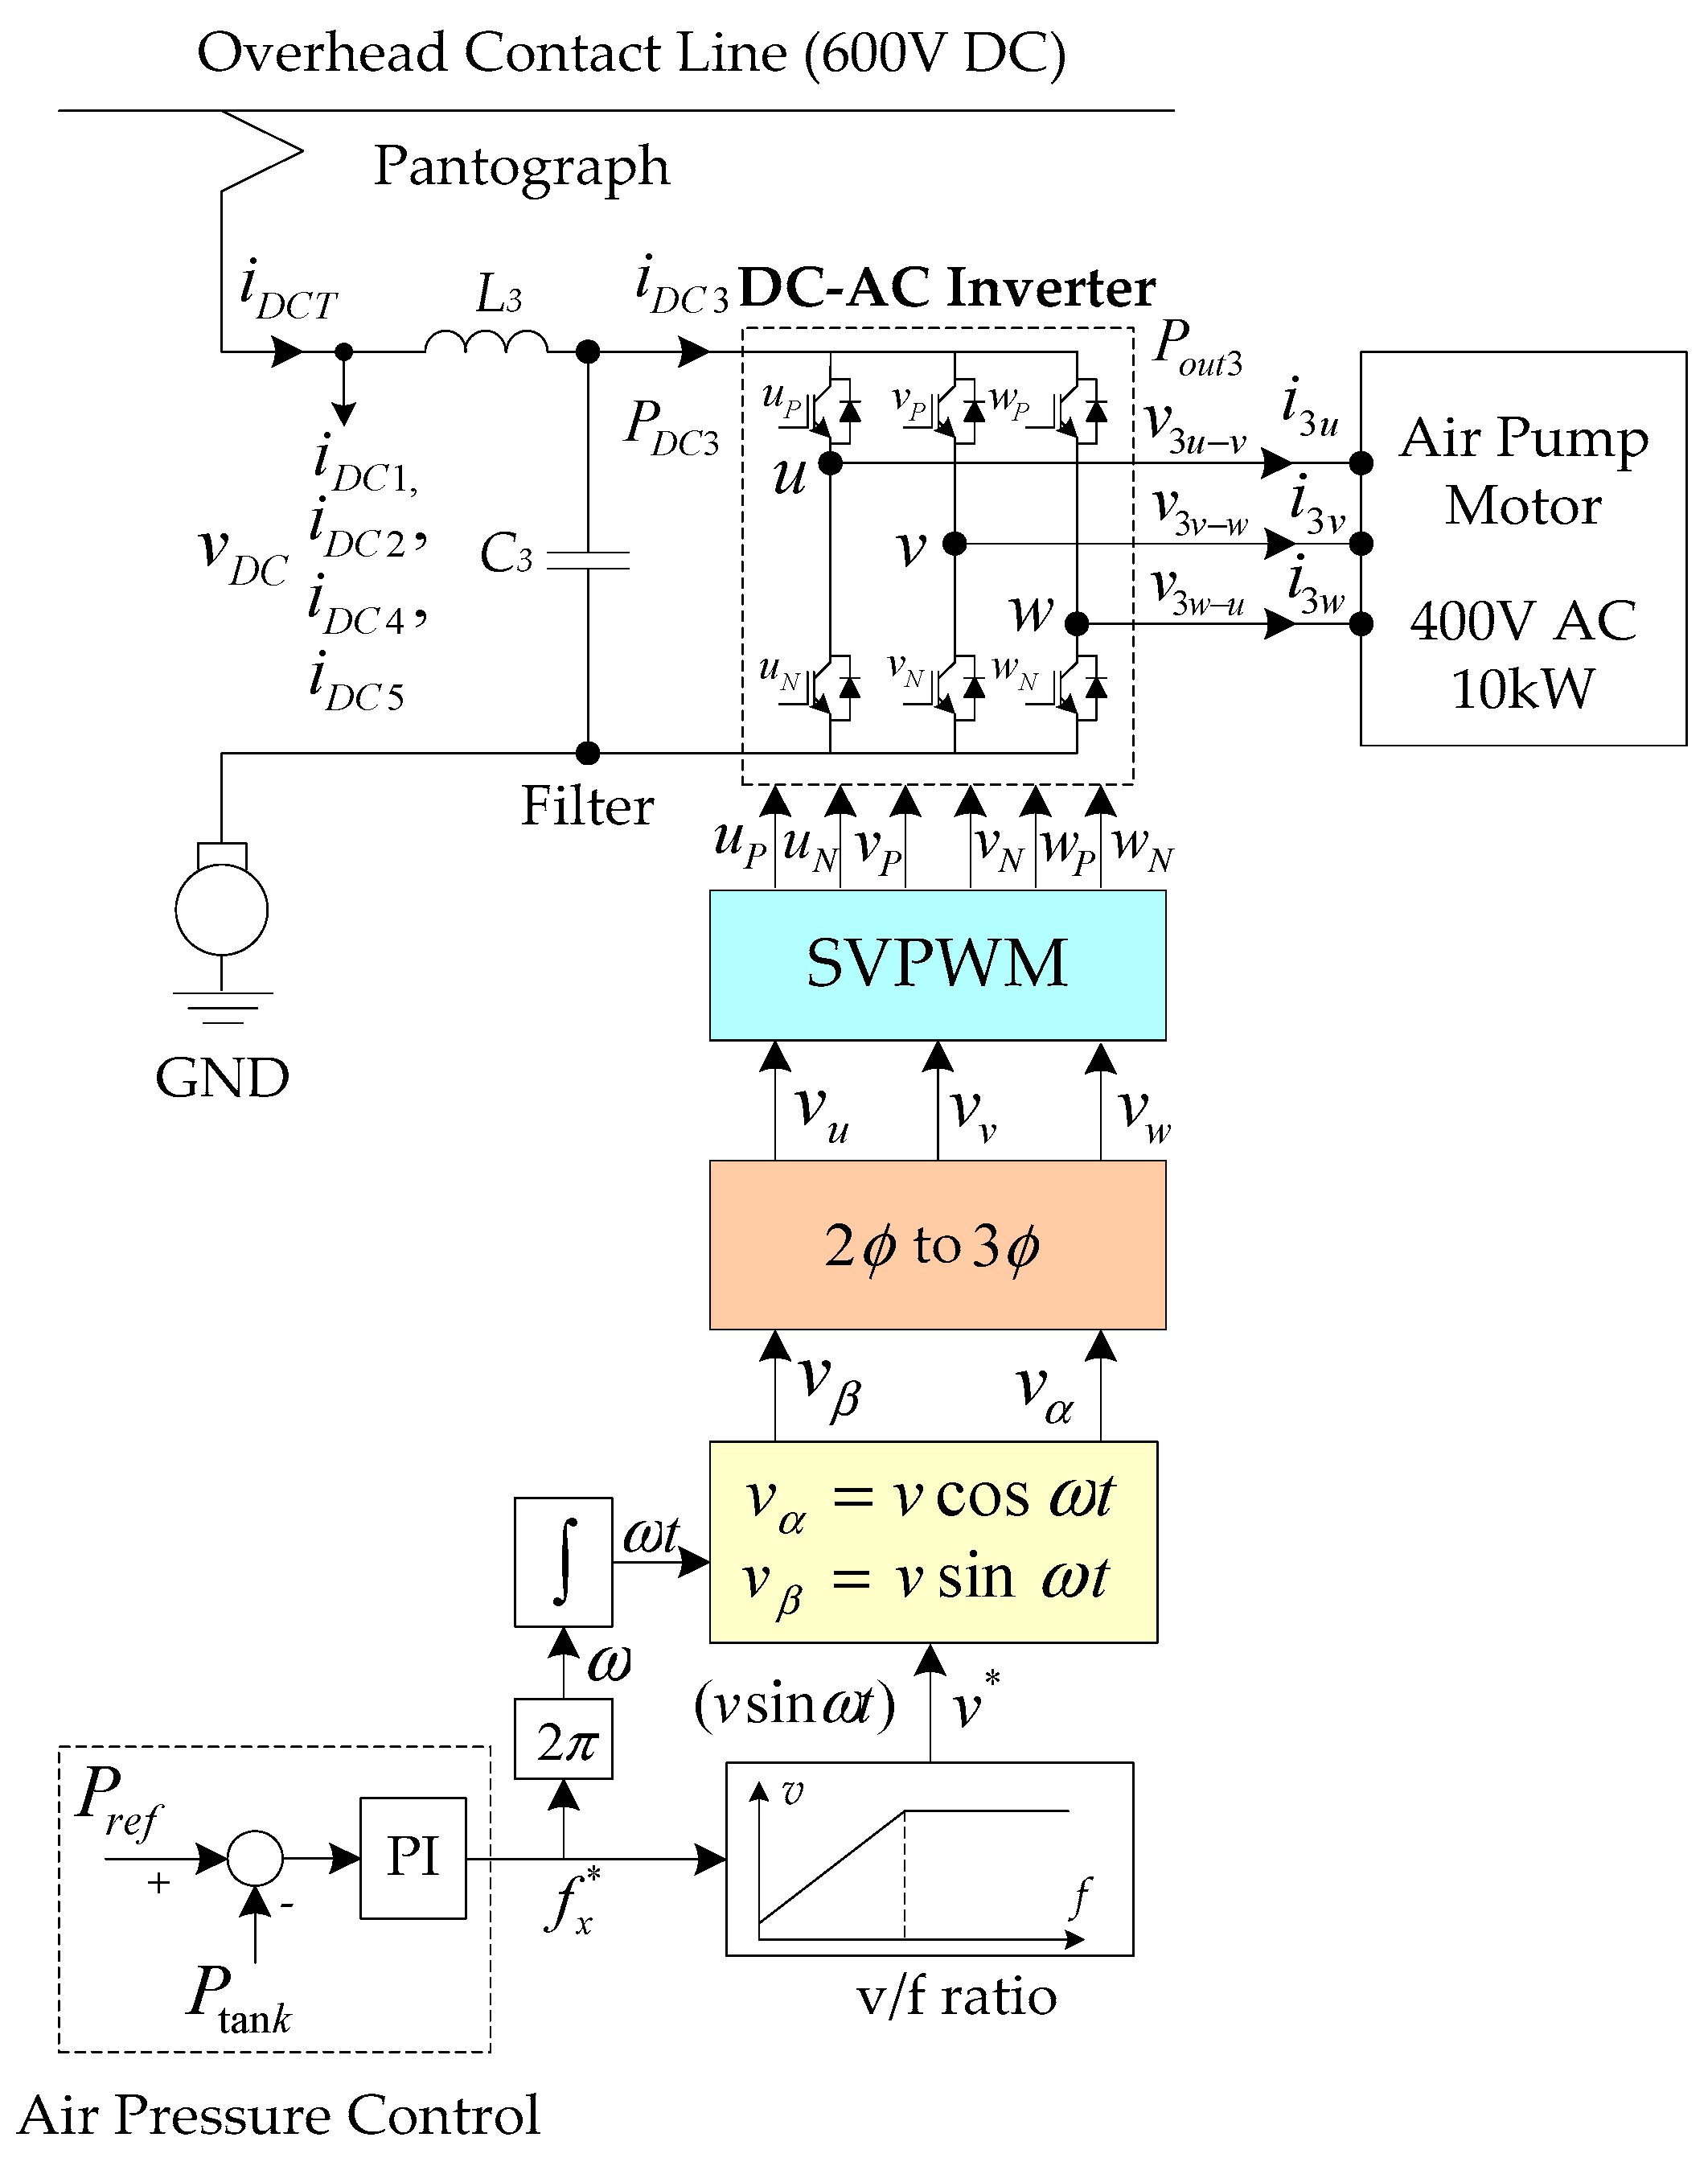
This section discusses the development and control of the compressor motors of the air conditioning system and the air pump motors of the air supply system. Figure 12 shows the schematic of the three-phase dc–ac inverters and the control diagram of the compressor motors of the air conditioning system (i.e., inverter modules 1 and 2). Figure 13 shows the schematic of the three-phase dc–ac inverters and the control diagram of the air pump motors of the air supply system (inverter modules 3 and 4). The rated power of the dc–ac inverters for the compressor motors is 2 × 20 kW, and that of the dc–ac inverters for the air pump motors is 2 × 10 kW.
3.2.1. Three-Phase dc–ac Inverters for the Compressor Motors (Inverter Modules 1 and 2)
As shown Figure 12, to control the speed of the compressor motors, the reference temperature () is first set by the LRV operator, and the passenger room temperature () is compared against . The PI controller is used to tune the discrepancy between and to the desired frequency (). The desired voltage () is calculated by multiplying the desired frequency () by the v/f ratio in the v/f lookup table. The relationship between and is expressed as:
The single-phase sinusoidal signal () based on and can be expressed as the following, where the angular speed () is obtained by multiplying the desired frequency () by and integrating.
To convert the single-phase sinusoidal signal () to two-phase sinusoidal signals ( with a 90° phase shift,
The two-phase sinusoidal signals ( are converted into three-phase sinusoidal signals (,, and ) with a 120° phase shift using inverse Clarke transformation as follows:
The three-phase sinusoidal signals (,, and) are used to generate six pulses of the gate driving signals (, , , , , and ) of IGBT switches using the SVPWM technique (Figure 10 and Figure 11). The amplitude of the line-to-line output voltage (, , ) of the three-phase dc–ac inverter is controlled by the modulation index (), as expressed in (22). Table 3 presents the relationship between the modulation index and the line-to-line voltage of the three-phase dc–ac inverters of the proposed APS system. In this research, the optimal is 0.9, achieving , , and of 381.6 Vrms, given the rated voltage of 400 VAC for inverter modules 1 and 2.
3.2.2. Three-Phase dc–ac Inverters for the Air Pump Motors (Inverter Modules 3 and 4)
In Figure 13, to control the speed of the air pump motors of the air supply system, the reference pressure () is first set by the LRV operator, and the actual air pressure () is compared against . The PI controller is used to tune the discrepancy between and to the desired frequency (). The desired voltage () is calculated by multiplying by the v/f ratio in the v/f lookup table. The procedure to generate the switching pattern of the IGBT switches in modules 3 and 4 is identical to that for modules 1 and 2 (following Equations (15) to (21)). The amplitudes of line-to-line output voltage (, , ) of three-phase dc–ac inverters are controlled by the modulation index (), as expressed in (22). The optimal is 0.9, achieving , , and of 381.6 Vrms, given the rated voltage of 400 VAC for inverter modules 3 and 4.
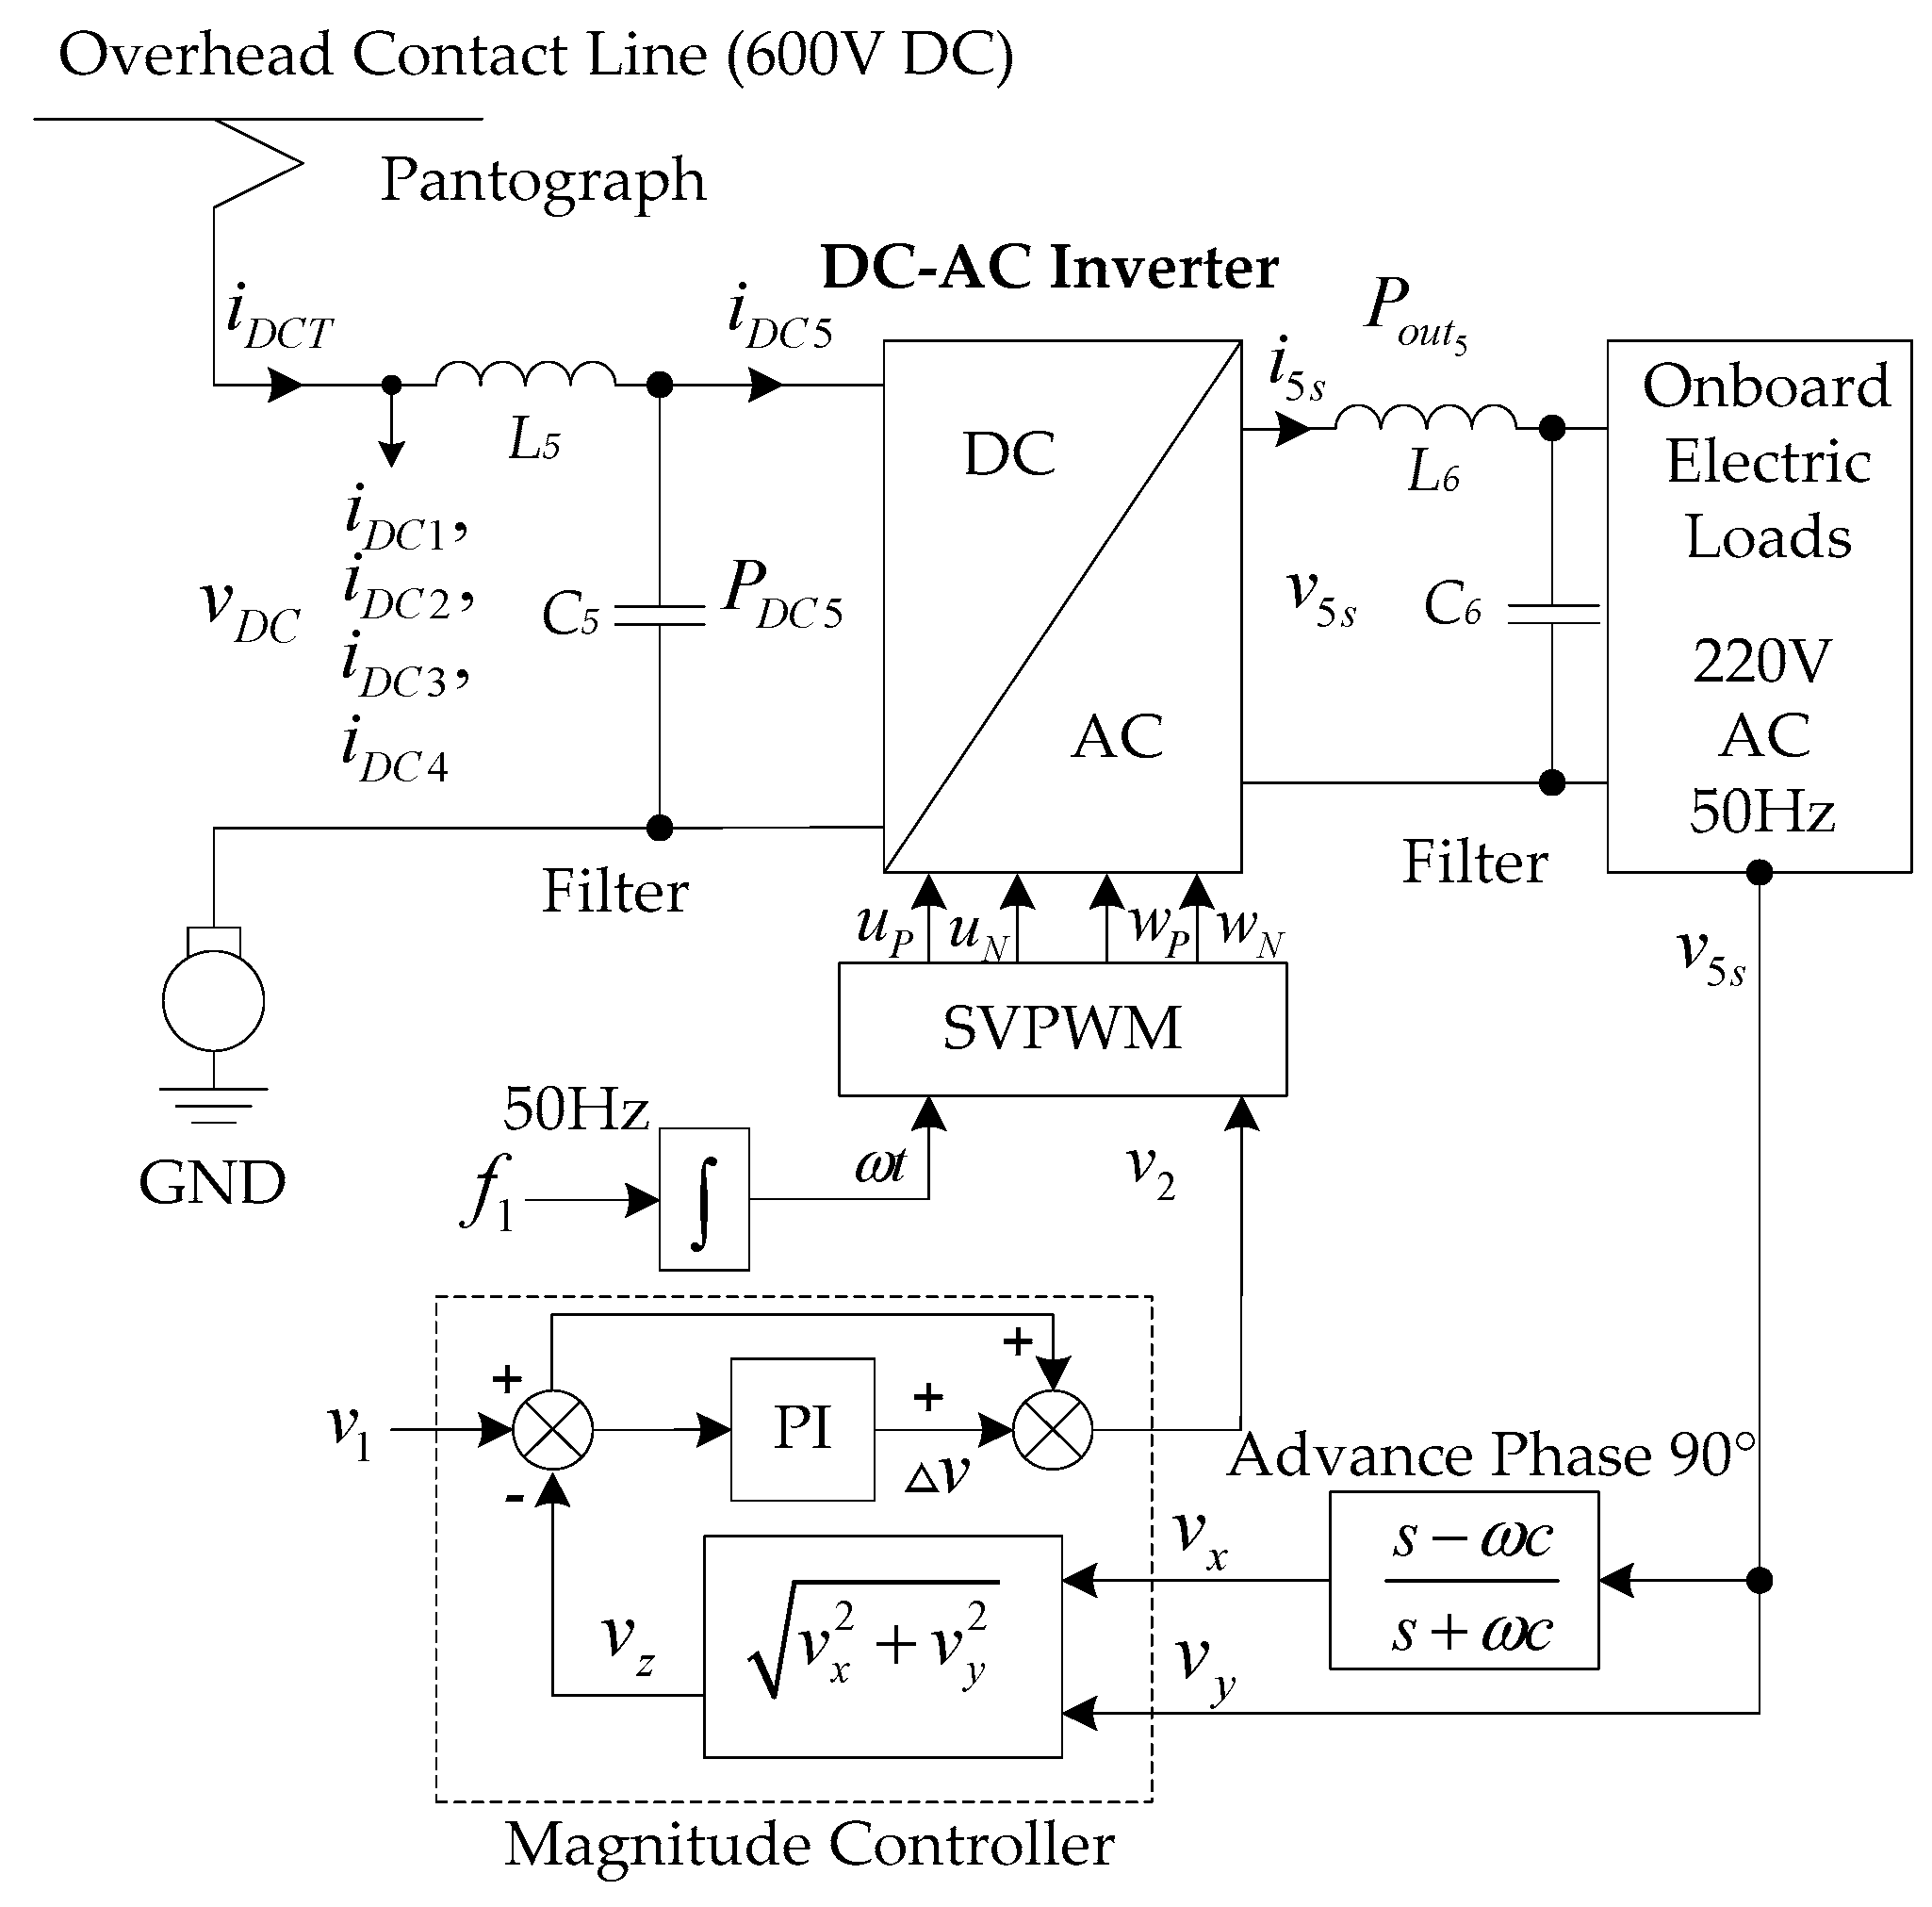
3.3. Development of Single-Phase DC–AC Inverter Module
The onboard electric loads, such as the lighting, fans, electric doors, and 24 VDC battery charging system, are powered by a 220 VAC 50 Hz single-phase power supply. Figure 14 shows the magnitude-control diagram of the dc–ac inverter for the single-phase power supply (i.e., inverter module 5).
The operation principles of inverter module 5 are as follows:
- The input command voltage () is 220 VAC;
- The input command voltage () is compared against the amplitude of the measured output voltage (), and the difference between voltages and () is controlled by the proportional-integral (PI) controller. The feedforward voltage () is the summation of and and is expressed as
- The command frequency () is 50 Hz, and through the integrator, the angular speed () and time () are obtained;
- The overhead contact line voltage () is converted to single-phase 220 VAC (i.e., the output voltage of the dc–ac inverter) by SVPWM with , , and as the inputs;
- The output voltage of the dc–ac inverter is converted into sinusoidal waveform by using the LC low-pass filter;
- The switching frequency () of the single-phase dc–ac inverter is 10 kHz.
4. Experimental Results of Auxiliary Power Supply System
The performance of the proposed APS system for the low-floor LRV is evaluated under variable load torques (25–100%) and output frequencies (10–50 Hz) for the three-phase dc–ac inverter modules for the compressor motors (modules 1 and 2) and the air pump motors (modules 3 and 4). The performance of the dc–ac inverter for the single-phase 220 VAC power supply (module 5) is evaluated under full load (resistive load = 100%) and no load (resistive load = 0%). Table 4 presents the specifications of the onboard electric loads on the low-floor LRV.
4.1. Manufacturing of the APS System
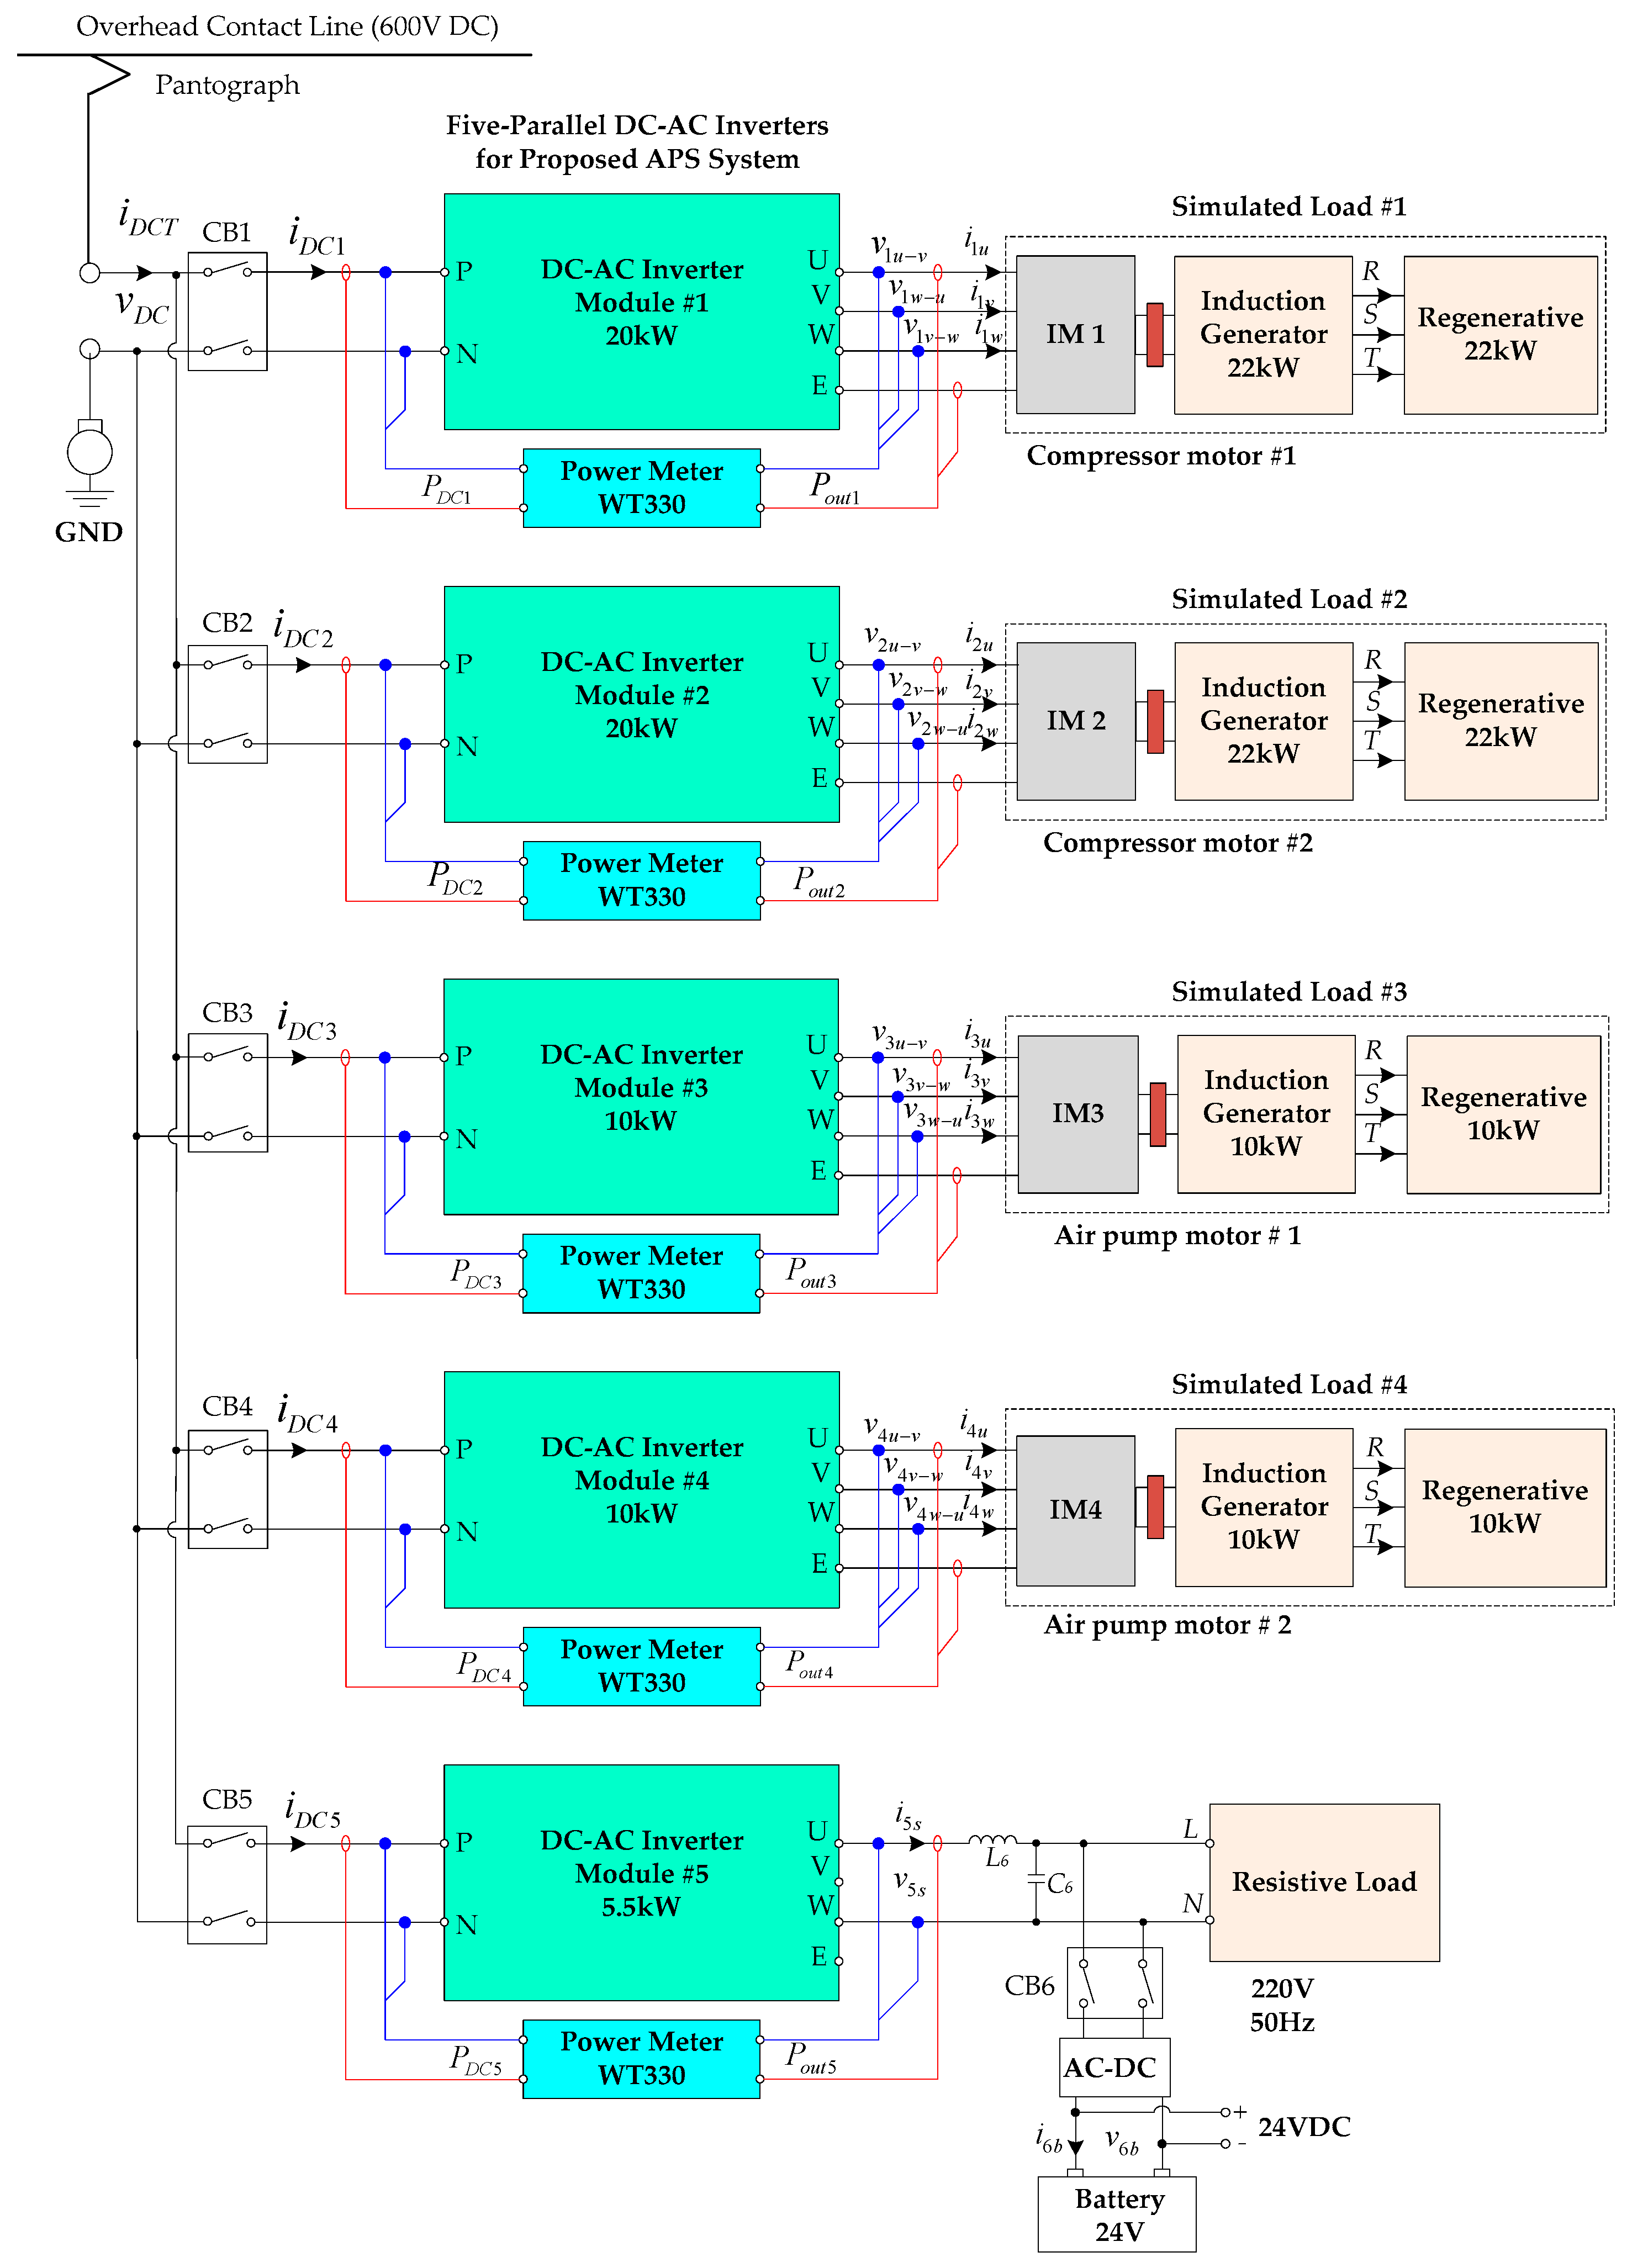
Figure 15 shows the schematic of the proposed APS system for the low-floor LRV, consisting of five dc–ac inverter modules. Specifically, the proposed APS system consists of two 20 kW three-phase dc–ac inverter modules for the compressor motors (inverter modules 1 and 2), two 10 kW three-phase dc–ac inverter modules for the air pump motors (inverter modules 3 and 4), and one 5.5 kW dc–ac inverter for the single-phase 220 VAC power supply (inverter module 5).
The 20 kW three-phase dc–ac inverters for the compressor motors (i.e., inverter modules 1 and 2) consist of a 100 A dc circuit breaker (CB), inrush current limiter, LC low-pass filter, IGBT switches, three-phase switching board (APY Engineering Co., Ltd., Bangkok, Thailand), and microcontroller unit (MCU; SH7125, Renesas). The inrush current limiter is used to limit the initial larger flow of electric charge to the capacitor (C), and the LC low-pass filter is used to reduce the ripple of overhead contact line voltage (). The IGBT switches are of 75 A 1200 V switches (PM75CL1A120, Mitsubishi Electric, Tokyo, Japan).
The input power of inverter module 1 () is equal to the overhead contact line voltage () multiplied by the input current (). The three-phase output voltages and output currents of inverter module 1 are , , , and , , , respectively. The three-phase output power () of inverter module 1 is measured by the two-wattmeter method. The input power of inverter module 2 () is equal to the overhead contact line voltage () multiplied by the input current (). The three-phase output voltage and output current of inverter module 2 are , , , and , , , respectively. The three-phase output power () of inverter module 2 is measured by the two-wattmeter method.
The 10 kW three-phase dc–ac inverters for the air pump motors (i.e., inverter modules 3 and 4) consist of a 40 A dc circuit breaker (CB), inrush current limiter, LC low-pass filter, IGBT switches, three-phase switching board (APY Engineering Co., Ltd.), and microcontroller unit (MCU; SH7125, Renesas). The inrush current limiter is used to limit the initial larger flow of electric charge to the capacitor (C), and the LC low-pass filter is used to reduce the ripple of overhead contact line voltage (). The IGBT switches are 50 A 1200 V switches (6MBP50RA120, Mitsubishi Electric, Japan).
The input power of inverter module 3 () is equal to the overhead contact line voltage () multiplied by the input current (). The three-phase output voltage and output current of inverter module 3 are , , , and , , , respectively. The three-phase output power () of inverter module 3 is measured by the two-wattmeter method. The input power of inverter module 4 () is equal to the overhead contact line voltage () multiplied by the input current (). The three-phase output voltage and output current of inverter module 4 are , , , and , , , respectively. The three-phase output power () of inverter module 4 is measured by the two-wattmeter method.
The 5.5 kW dc–ac inverter for the single-phase 220 VAC power supply (i.e., inverter module 5) consists of a 40 A dc circuit breaker (CB), inrush current limiter, LC low-pass filter, IGBT switches, three-phase switching board (APY Engineering Co., Ltd.), and microcontroller unit (MCU; RX24T, Renesas). The inrush current limiter is used to limit the initial large flow of electric charge to the capacitor (C), and the LC low-pass filter is used to reduce the ripple of overhead contact line voltage (). The IGBT switches are 75 A 1200 V switches (7MBP75RA120, Fuji Electric, Japan). A current sensor (L08P050D15, Tamura) is used to measure the output current of the dc–ac inverter. The ac–dc rectifier circuit is used to convert 220 VAC 50 Hz to 24 VDC for the electric doors controller and the control system of the low-floor LRV.
The input power of inverter module 5 () is equal to the overhead contact line voltage () multiplied by the input current (). The output voltage and output current of inverter module 5 are and . The single-phase output power () is measured by a wattmeter (WT330, Yokogawa). The RS485 Modbus communication ports are used for the centralized control of inverter modules 1–5.
Figure 16a shows the 3D model of the proposed APS system generated by SolidWorks modeling software, consisting of two three-phase compressor motors (inverter modules 1–2), two three-phase air pump motors (inverter modules 3–4), and one single-phase power supply (inverter module 5). Figure 16b shows the prototype of the proposed APS system, consisting of 2 × 20 kW three-phase compressor motors, 2 × 10 kW three-phase air pump motors, and 5.5 kW 220 VAC 50 Hz single-phase power supply.
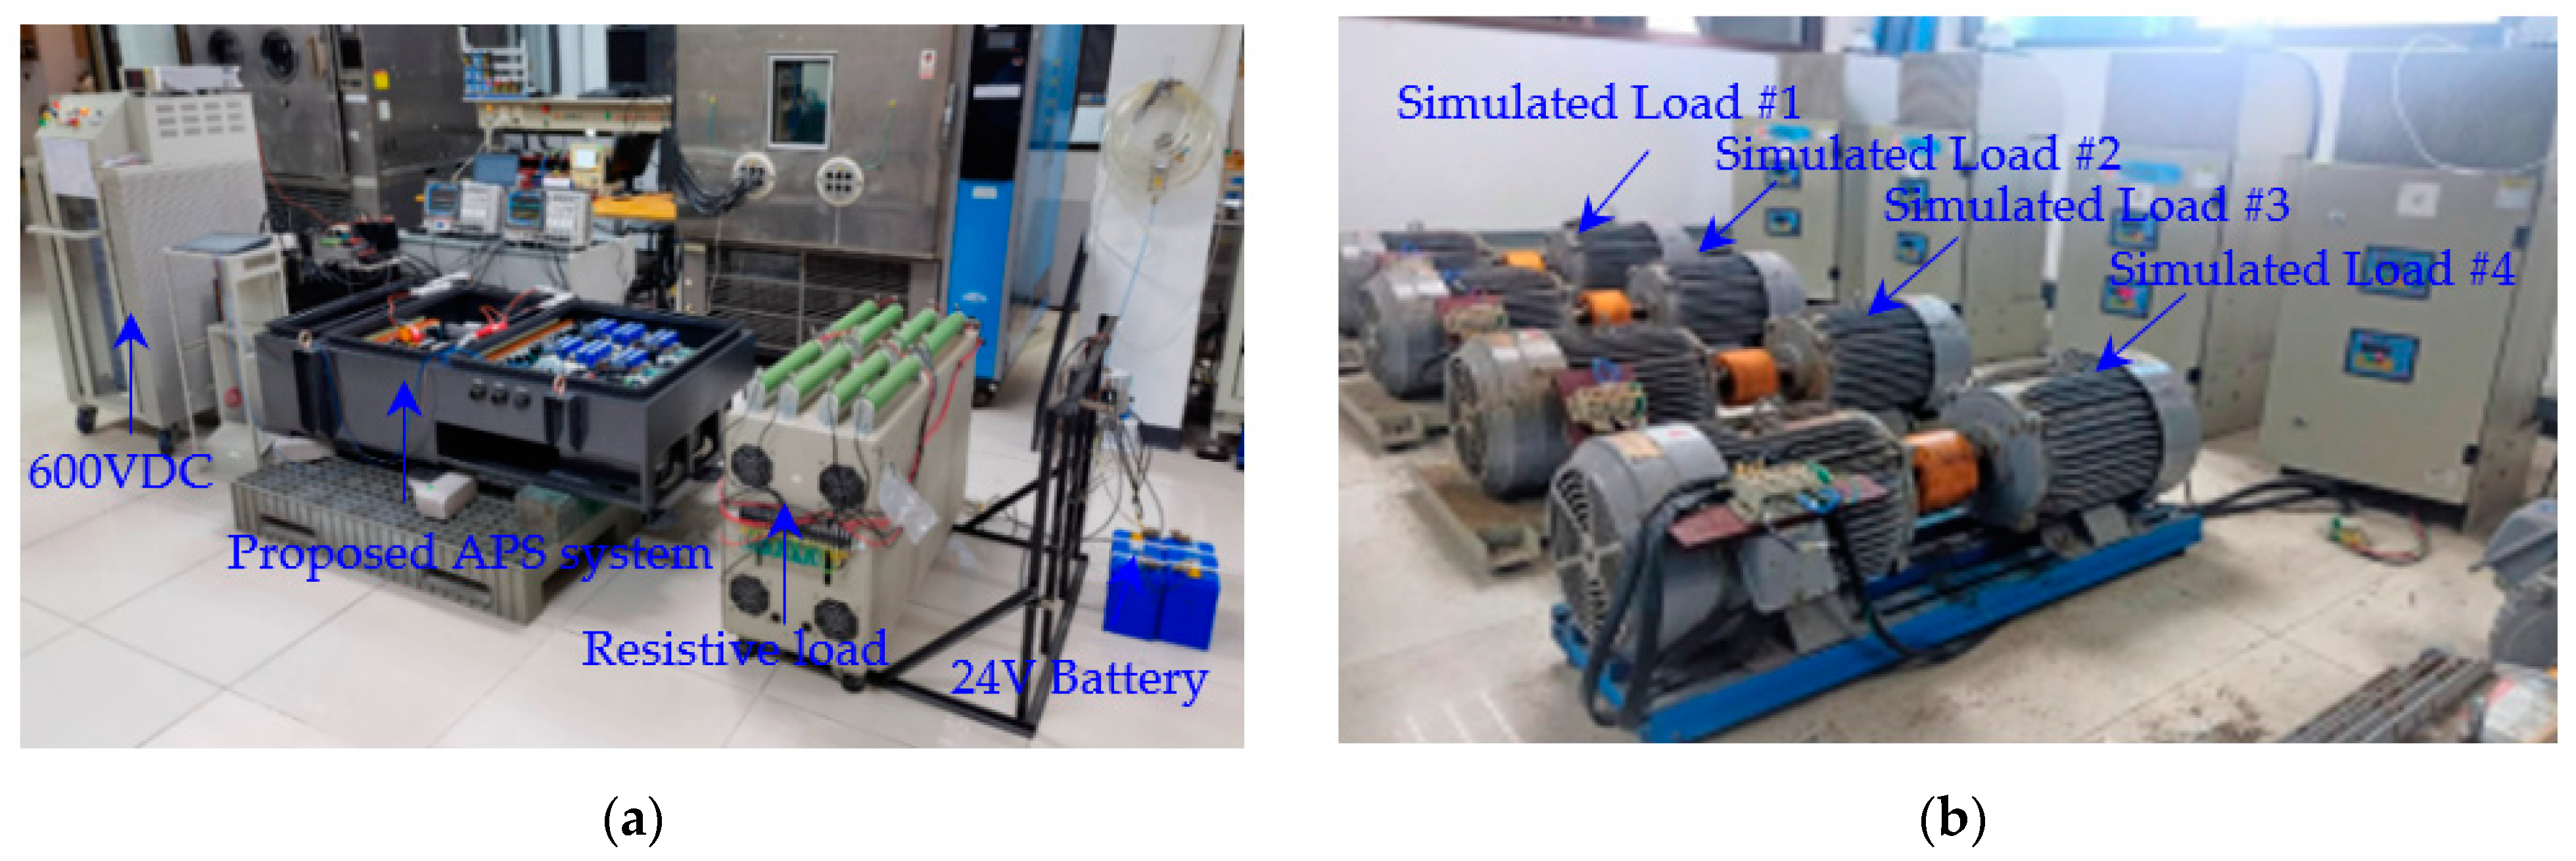
Figure 17a shows the SolidWorks-generated 3D model of the proposed APS system with metal casings and electrical enclosures as per the Ingress Protection (IP) 65 code against intrusion, dust, accidental contact, and water. Figure 17b shows the prototype of the APS system with metal casings and electric enclosures according to the IP65 code. Figure 18 shows the experimental setup of the proposed APS system.
4.2. Experiment of the Proposed APS System Using Simulated Loads
To validate the performance of the proposed APS system, experiments were carried out by testing the simulated loads (i.e., simulated loads 1–5) in steady state at the manufacturing site. The experimental results are subsequently compared with the MATLAB/Simulink simulation results.
Figure 19 shows the schematic of the experiment of the proposed APS system (inverter modules 1–5) with the simulated loads. The input power and output power are measured by the power meters (WT330 model, Yokogawa, Japan) to evaluate the efficiency and power loss under full-load operation. The oscilloscopes (GW INSTEK GDS-2204 A) and isolated probes (MICSIG DP10013) are used to measure the waveforms of overhead contact line voltage (), dc input current (), line-to-line output voltage (, , and ) and ac output currents (, , and ) of modules 1–4, and the line-to-neutral output voltage () and ac output current () of module 5. The switching frequency of the three-phase dc–ac inverters of the compressor motors (modules 1 and 2) are 4 kHz. The switching frequency for the three-phase dc–ac inverters of the air pump motors (modules 3 and 4) is 3 kHz.
4.3. Simulation and Experimental Results
4.3.1. Three-Phase dc–ac Inverters for the Compressor Motors (Inverter Modules 1 and 2)
The simulation and experiment of the three-phase dc–ac inverters for the compressor motors of the air conditioning system (inverter modules 1 and 2) are carried out under the following conditions: (a) the overhead contact line voltage () is 600 VDC; (b) the load torque is varied between 25%, 50%, 75%, and 100%; and (c) the output frequency () is varied between 10 Hz, 20 Hz, 30 Hz, 40 Hz, and 50 Hz.
The performance metrics of inverter modules 1 and 2 include (i) the waveforms of input voltage (i.e., overhead contact line voltage; ) and of input current of module 1 () and module 2 (); (ii) the waveforms of output voltage (, , ) and output current (, , ) of module 1 and the waveforms of output voltage (, , ) and output current (, , ) of module 2; and (iii) the input power of module 1 () by multiplying by , and the input power of module 2 () by multiplying by .
Figure 20 shows, as an example, the simulated and measured waveforms of the three-phase dc–ac inverter for the compressor motor of the air conditioning system (module 1), given that = 600 V, = 50 Hz, and load torque = 100%. In Figure 20a,c, the simulated and measured overhead contact line voltage () are 600 V and 602 V. The simulated output voltages (, , and ) are 430 V, 430 V, and 430 V; and the measured output voltages are 433 V, 430 V, and 439 V. In Figure 20b,d, the simulated and measured dc input currents () are 38 A and 37.9 A. The simulated output currents (, , and ) are 40 A, 40 A, and 40 A; and the measured output currents are 39.9 A, 39.7 A, and 40.0 A.
Figure 21 shows, as an example, the simulated and measured waveforms of the three-phase dc–ac inverter for the compressor motor of the air conditioning system (module 1), given that = 600 V, = 50 Hz, and load torque = 75%. In Figure 21a,c, the simulated and measured overhead contact line voltages () are 600 V and 606 V. The simulated output voltages (, , and ) are 430 V, 430 V, and 430 V; and the measured output voltages are 436 V, 427 V, and 430 V. In Figure 21b,d, the simulated and measured dc input currents () are 28 A and 28.2 A. The simulated output currents (, , and ) are 30 A, 30 A, and 30 A; and the measured output currents are 30.6 A, 30.3 A, and 30.7 A.
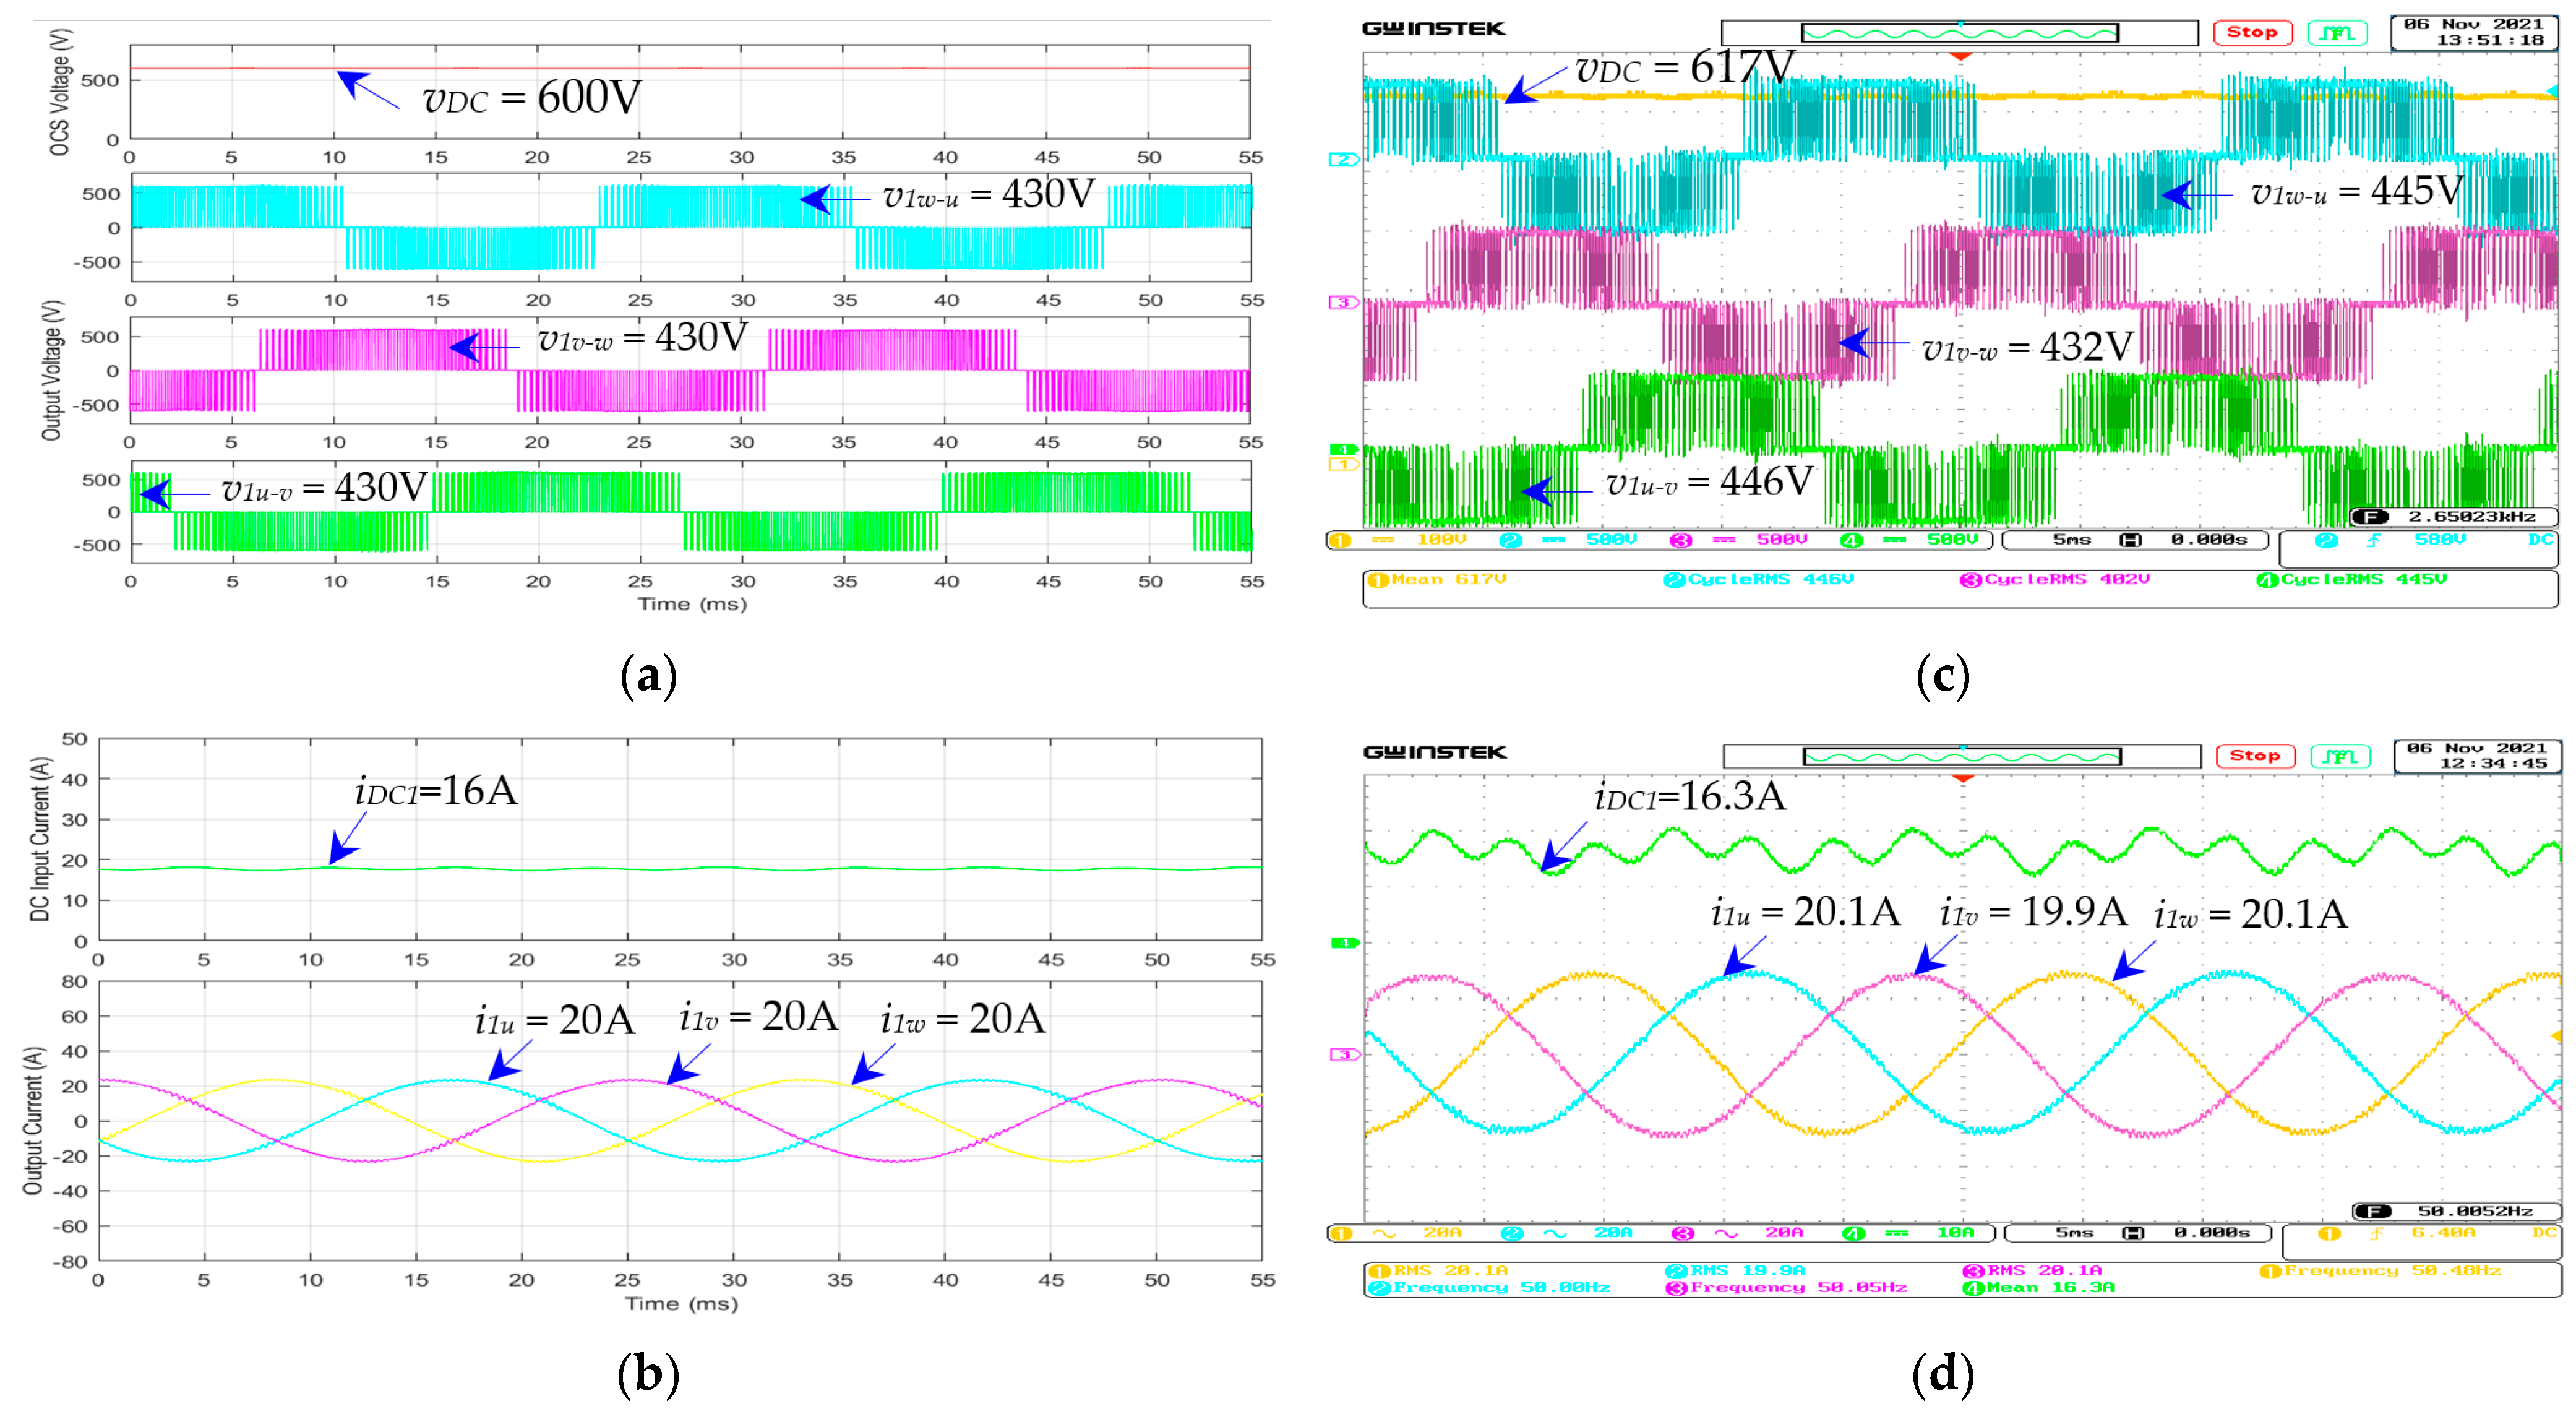
Figure 22 shows, as an example, the simulated and measured waveforms of the three-phase dc–ac inverter for the compressor motor of the air conditioning system (module 1), given that = 600 V, = 50 Hz, and load torque = 50%. In Figure 22a,c, the simulated and measured overhead contact line voltages () are 600 V and 617 V. The simulated output voltages (, , and ) are 430 V, 430 V, and 430 V; and the measured output voltages are 446 V, 432 V, and 445 V. In Figure 22b,d, the simulated and measured dc input currents () are 16 A and 16.3 A. The simulated output currents (, , and ) are 20 A, 20 A, and 20 A; and the measured output currents are 20.1 A, 19.9 A, and 20.1 A.
Figure 23 shows, as an example, the simulated and measured waveforms of the three-phase dc–ac inverter for the compressor motor of the air conditioning system (module 1), given that = 600 V, = 50 Hz, and load torque = 25%. In Figure 23a,c, the simulated and measured overhead contact line voltages () are 600 V and 614 V. The simulated output voltages (, , and ) are 430 V, 430 V, and 430 V; and the measured output voltage are 434 V, 432 V, and 441 V. In Figure 23b,d, the simulated and measured dc input currents () are 4 A and 4.11 A. The simulated output currents (, , and ) are 12 A, 12 A, and 12 A; and the measured output currents are 12.9 A, 12.7 A, and 13.0 A.
The simulated and measured waveforms of both three-phase dc–ac inverters for the compressor motors (i.e., modules 1 and 2) are identical.
Figure 24a shows the measured dc input current () of the three-phase dc–ac inverter of the compressor motor (module 1) under variable load torques (25–100%) and output frequencies (10–50 Hz). The maximum dc input current () is 37.9 A, given the load torque of 100% (full load) and output frequency of 50 Hz.
Figure 24b shows the measured dc input power () of the three-phase dc–ac inverter of the compressor motor (module 1) under variable load torques (25–100%) and output frequencies (10–50 Hz). The maximum dc input power () is 22.81 kW, given the load torque of 100% (full load) and output frequency of 50 Hz.
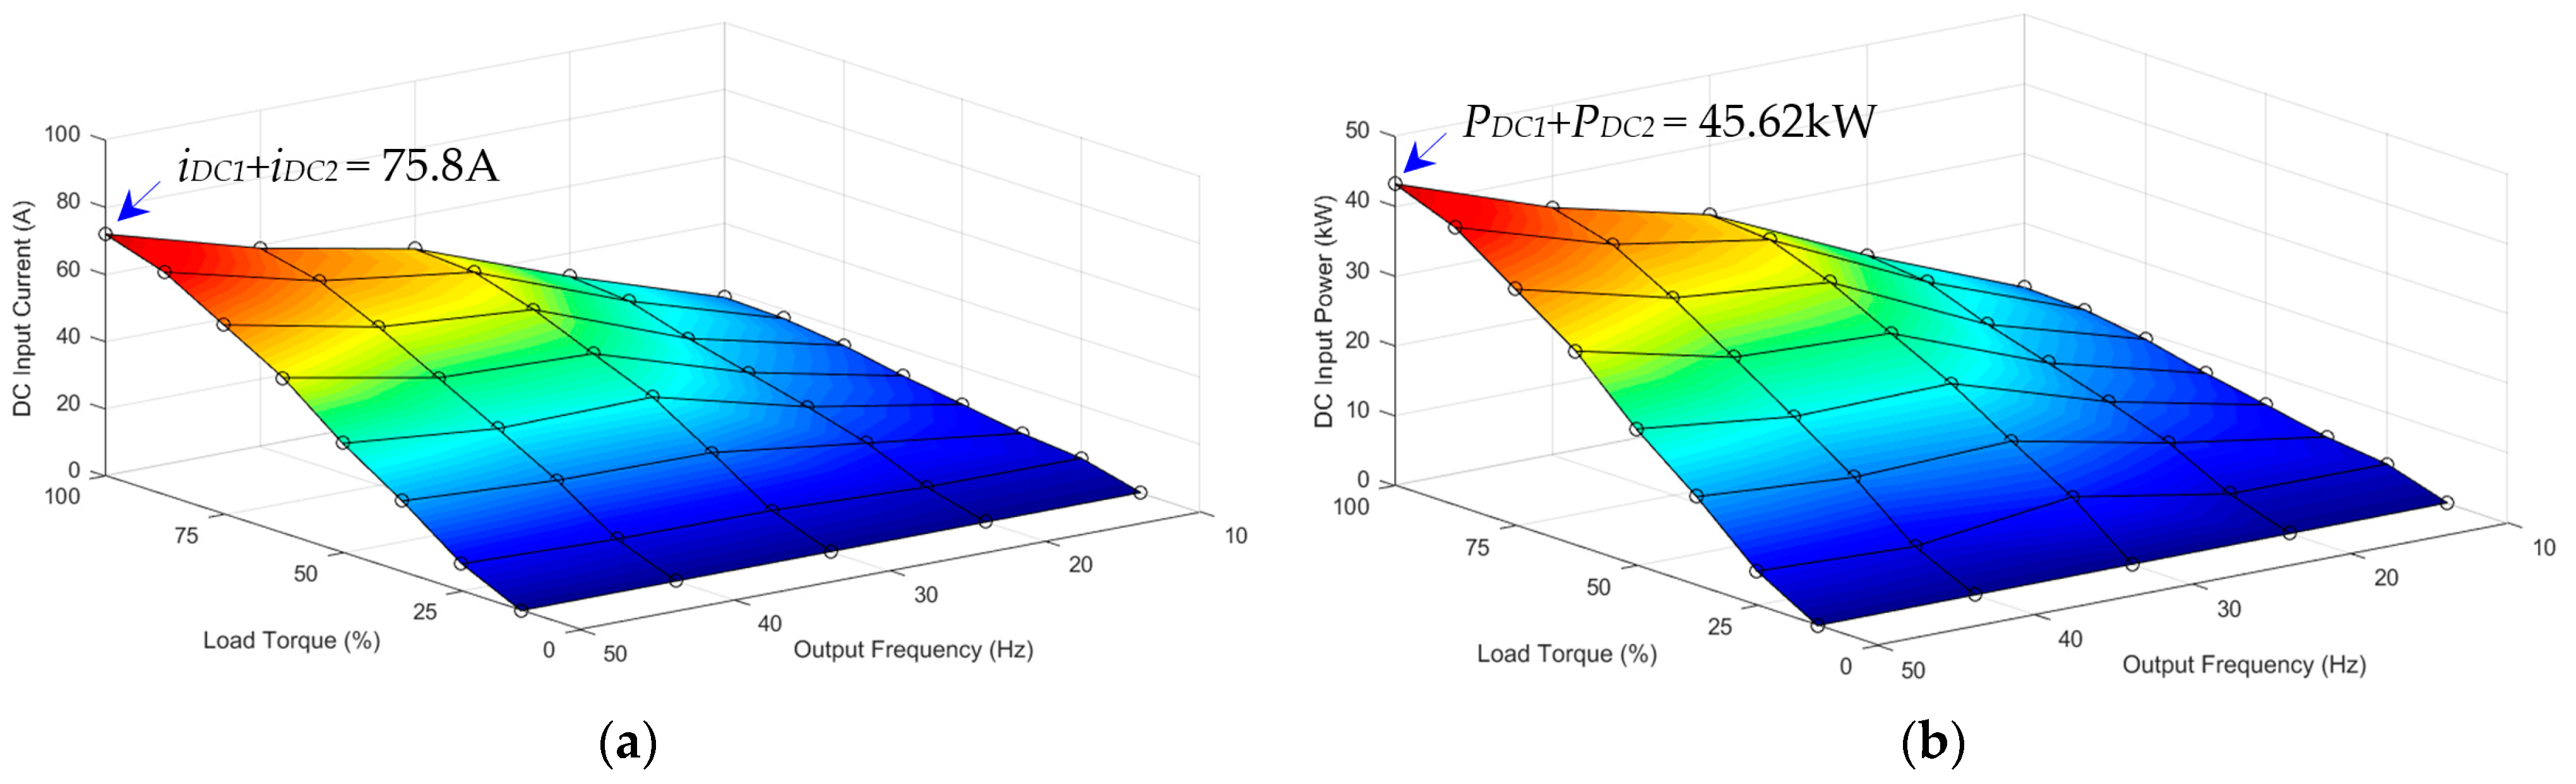
Figure 25a shows the measured dc input current ( and ) of the three-phase dc–ac inverters of the compressor motors (modules 1 and 2) under variable load torques (25–100%) and output frequencies (10–50 Hz). The dc input current of modules 1 and 2 (+) is 75.8 A, given the load torque of 100% (full load) and output frequency of 50 Hz.
Figure 25b shows the measured dc input power (and ) of the three-phase dc–ac inverters of the compressor motors (modules 1 and 2) under variable load torques (25–100%) and output frequencies (10–50 Hz). The dc input power of modules 1 and 2 (+) is 45.62 kW, given the load torque of 100% (full load) and output frequency of 50 Hz.
4.3.2. Three-Phase dc–ac Inverters for the Air Pump Motors (Inverter Modules 3 and 4)
The simulation and experiment of the three-phase dc–ac inverters for the air pump motors of the air supply system (inverter modules 3 and 4) are carried out under the following conditions: (a) the overhead contact line voltage () is 600 VDC; (b) the load torque is varied between 25%, 50%, 75%, and 100%; and (c) the output frequency () is varied between 10 Hz, 20 Hz, 30 Hz, 40 Hz, and 50 Hz.
The performance metrics of inverter modules 3 and 4 include (i) the waveforms of input voltage (i.e., overhead contact line voltage; ) and input current of module 3 () and module 4 (); (ii) the waveforms of output voltage (, , and ) and output current (, , and ) of module 3 and the waveforms of output voltage (, , and ) and output current (, , and ) of module 4; and (iii) the input power of module 3 () by multiplying by and the input power of module 4 () by multiplying by .
Figure 26 shows, as an example, the simulated and measured waveforms of the three-phase dc–ac inverter for the air pump motor of the air supply system (module 3), given that = 600 V, fs = 50 Hz, and load torque = 100%. In Figure 26a,c, the simulated and measured overhead contact line voltages () are 600 V and 602 V. The simulated output voltages (, , and ) are 430 V, 430 V, and 430 V; and the measured output voltages are 432 V, 428 V, and 444 V. In Figure 26b,d, the simulated and measured dc input currents () are 14 A and 14.4 A. The simulated output currents (, , ) are 14 A, 14 A, and 14 A; and the measured output currents are 14.2 A, 13.9 A, and 14.2 A.
Figure 27 shows, as an example, the simulated and measured waveforms of the three-phase dc–ac inverter for the air pump motor of the air supply system (module 3), given that = 600 V, = 50 Hz, and load torque = 75%. In Figure 27a,c, the simulated and measured overhead contact line voltages () are 600 V and 613 V. The simulated output voltages (, , and ) are 430 V, 430 V, and 430 V; and the measured output voltages are 441 V, 437 V, and 446 V. In Figure 27b,d, the simulated and measured dc input currents () are 12 A and 11.9 A. The simulated output currents (, , and ) are 10 A, 10 A, and 10 A; and the measured output currents are 10.0 A, 9.91 A, and 10.0 A.
Figure 28 shows, as an example, the simulated and measured waveforms of the three-phase dc–ac inverter for the air pump motor of the air supply system (module 3), given that = 600 V, = 50 Hz, and load torque = 50%. In Figure 28a,c, the simulated and measured overhead contact line voltages () are 600 V and 607 V. The simulated output voltages (, , and ) are 430 V, 430 V, and 430 V; and the measured output voltages are 439 V, 438 V, and 446 V. In Figure 28b,d, the simulated and measured dc input currents () are 7 A and 7.1 A. The simulated output currents (, , and ) are 6 A, 6 A, and 6 A; and the measured output currents are 6.0 A, 5.97 A, and 6.0 A.
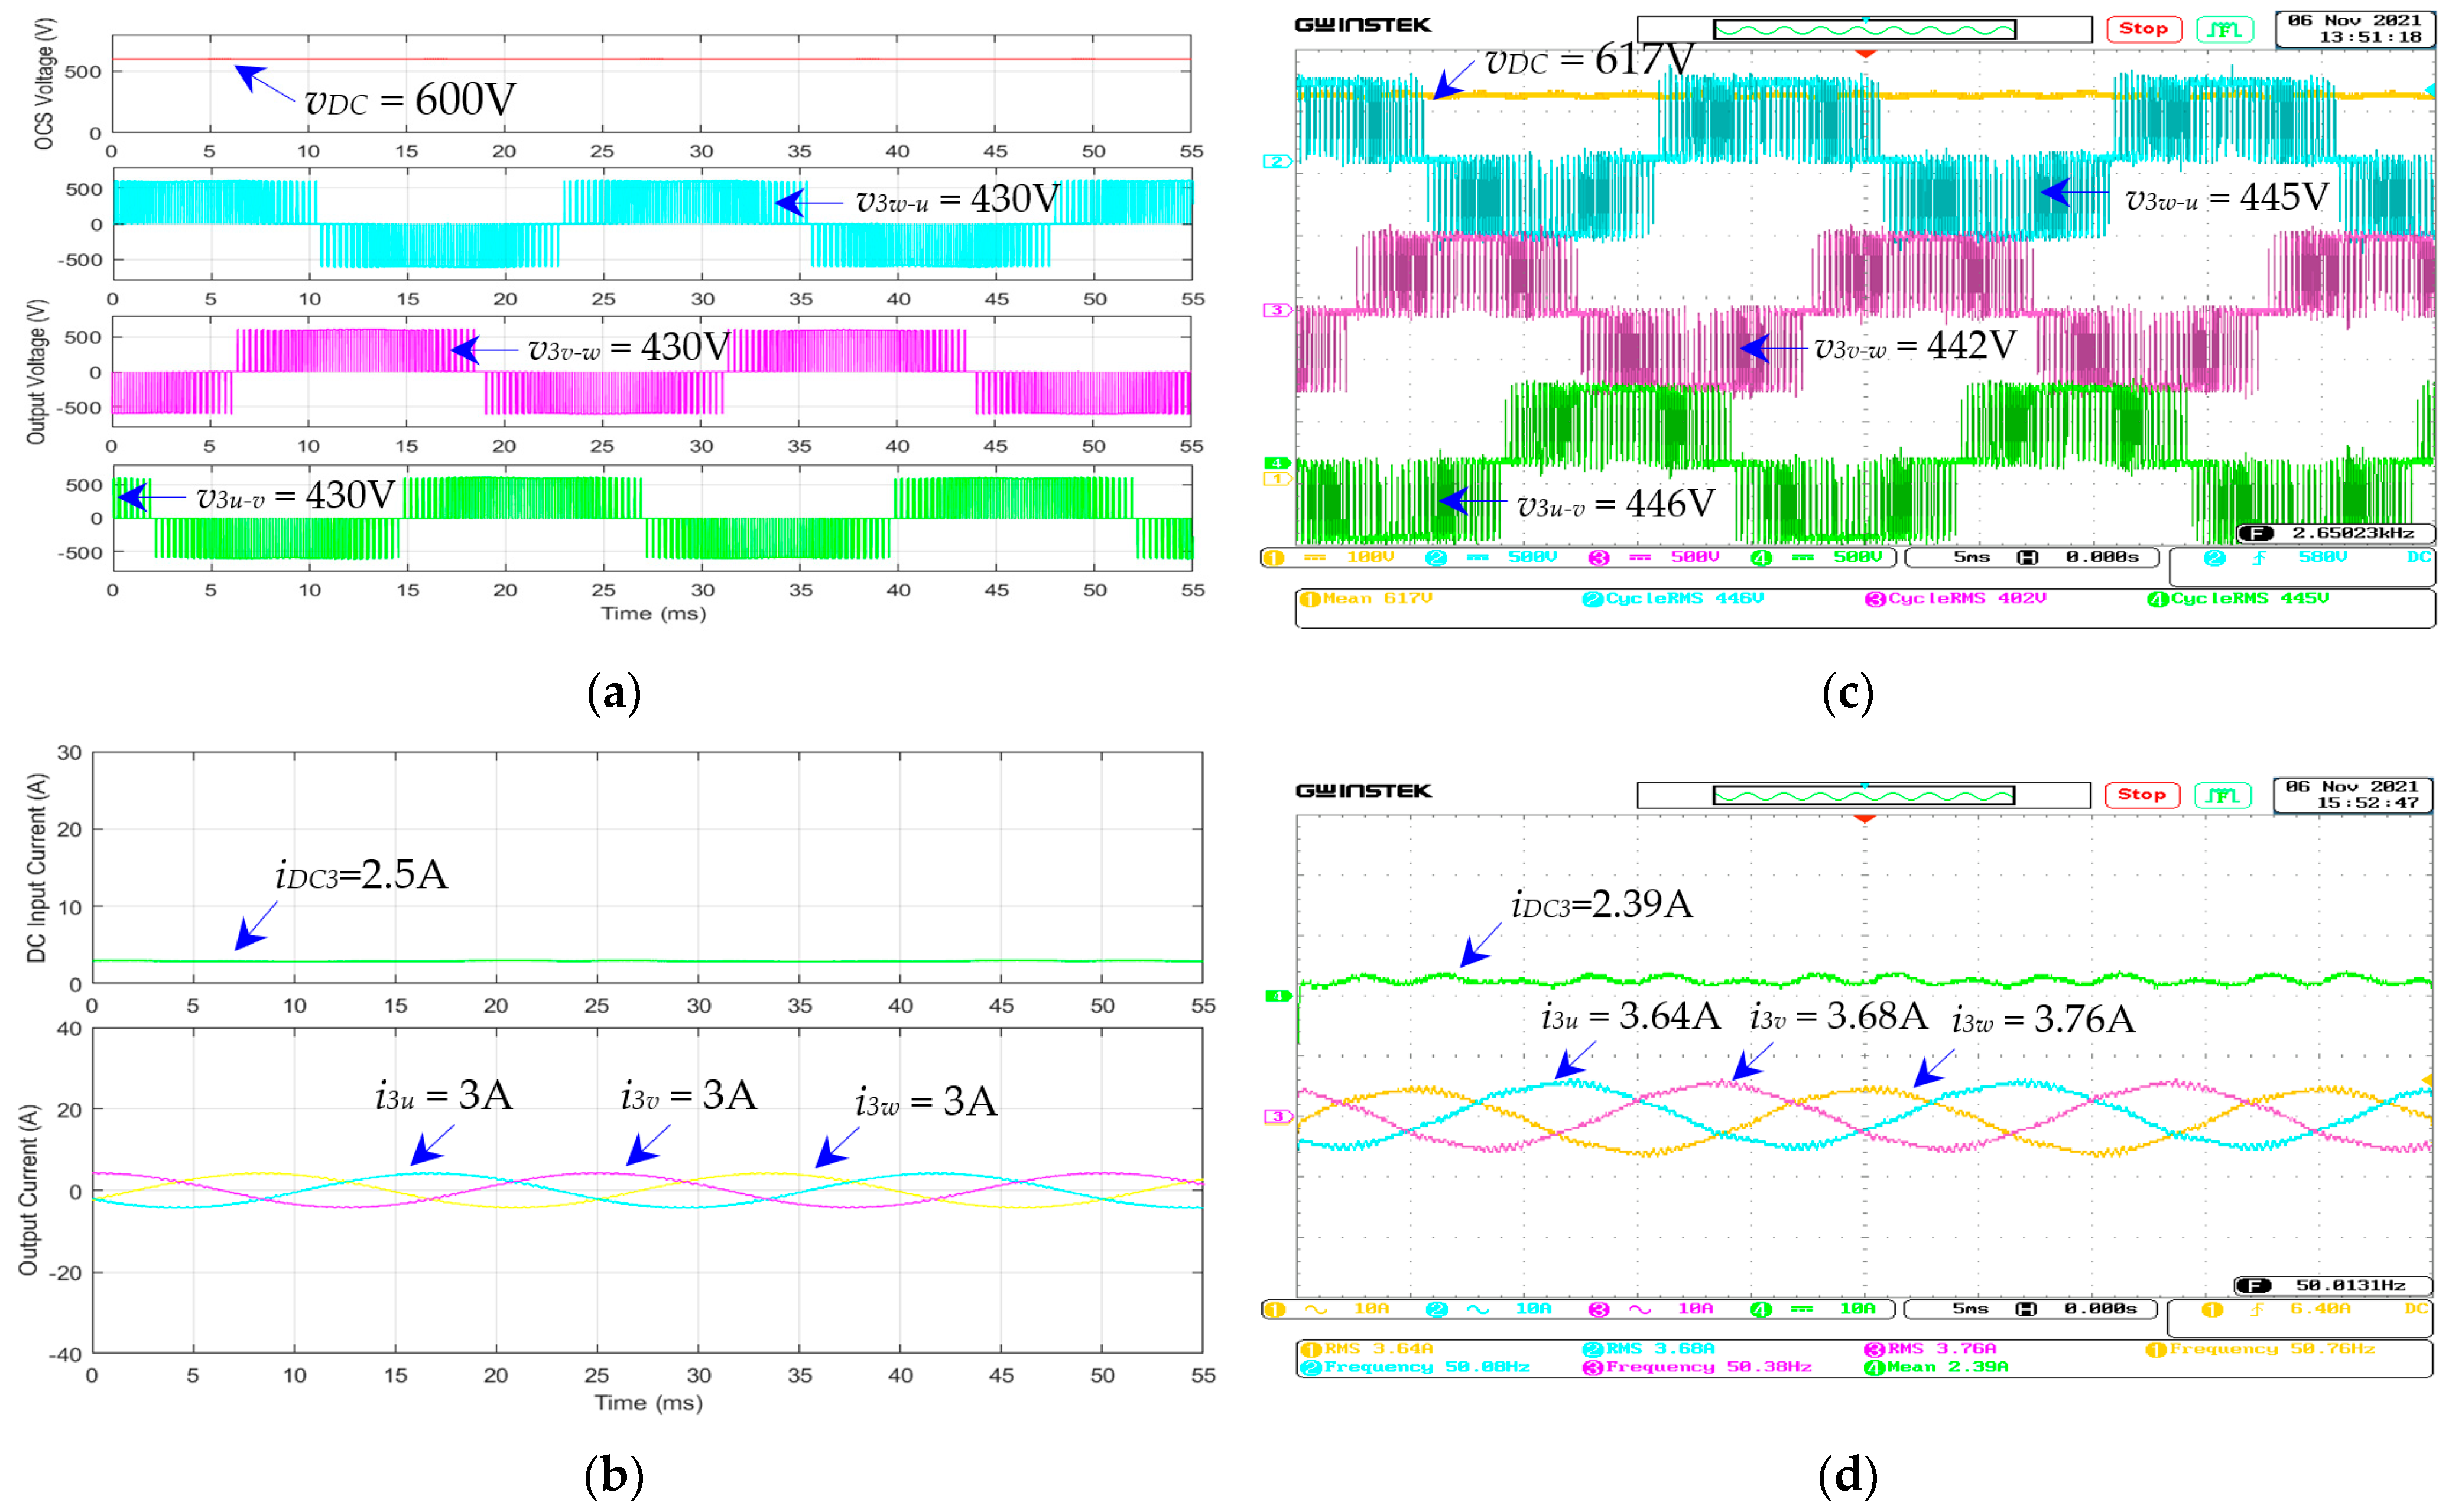
Figure 29 shows, as an example, the simulated and measured waveforms of the three-phase dc–ac inverter for the air pump motor of the air supply system (module 3), given that = 600 V, = 50 Hz, and load torque = 25%. In Figure 29a,c, the simulated and measured overhead contact line voltages () are 600 V and 617 V. The simulated output voltages (, , and ) are 430 V, 430 V, and 430 V; and the measured output voltages are 446 V, 442 V, and 445 V. In Figure 29b,d, the simulated and measured dc input currents () are 2.5 A and 2.39 A. The simulated output currents (, , and ) are 3 A, 3 A, and 3 A; and the measured output currents are 3.64 A, 3.68 A, and 3.76 A.
The simulated and measured waveforms of both three-phase dc–ac inverters for the air pump motors (i.e., modules 3 and 4) are identical.
Figure 30a shows the measured dc input current () of the three-phase dc–ac inverter of the air pump motor (module 3) under variable load torques (25–100%) and output frequencies (10–50 Hz). The maximum dc input current () is 14.4 A, given the load torque of 100% (full load) and output frequency of 50 Hz.
Figure 30 b shows the measured dc input power () of the three-phase dc–ac inverter of the air pump motor (module 3) under variable load torques (25–100%) and output frequencies (10–50 Hz). The maximum dc input power () is 8.67 kW, given the load torque of 100% (full load) and output frequency of 50 Hz.
Figure 31a shows the measured dc input current ( and ) of the three-phase dc–ac inverters of the air pump motors (modules 3 and 4) under variable load torques (25–100%) and output frequencies (10–50 Hz). The dc input current of modules 3 and 4 ( + ) is 28.8 A, given the load torque of 100% (full load) and output frequency of 50 Hz.
Figure 31b shows the measured dc input power ( and ) of the three-phase dc–ac inverters of the air pump motors (modules 3 and 4) under variable load torques (25–100%) and output frequencies (10–50 Hz). The dc input power of modules 3 and 4 ( + ) is 17.34 kW, given the load torque of 100% (full load) and output frequency of 50 Hz.
4.3.3. The dc–ac Inverter for 220 VAC Single-Phase Power Supply (Inverter Module 5)
The simulation and experiment of the dc–ac inverter for the 220 VAC single-phase power supply (inverter module 5) are carried out under the following conditions: (a) the overhead contact line voltage () is 600 VDC; (b) the resistive load is varied between 0% (no load) and 100% (full load); and (c) the output frequency () is 50 Hz.
The performance metrics of inverter module 5 include (i) the waveform of input voltage (i.e., overhead contact line voltage; ); (ii) the waveform of input current of module 5 (); (iii) the waveform of output voltage (); (iv) the waveform of output current (); and (v) the input power of module 5 () by multiplying by .
Figure 32a,b show the simulated and measured , , , and waveforms of the dc–ac inverter for the single-phase power supply (module 5) under the full-load condition (resistive load = 100%), given that = 600 V and = 50 Hz. Figure 32c,d show the corresponding , , , and waveforms of module 5 under the no-load condition (resistive load = 0%). Under the full-load condition (Figure 32a,b), the simulated , , , and are 600 V, 10 A, 330 V, and 24 A; and the measured , , , and are 602 V, 9.76 A, 329 V, and 24.10 A. The simulated and measured input powers (PDC5) of the dc–ac inverter for the 220 VAC single-phase power supply at full load are 6.0 kW and 5.87 kW. Under the no-load condition (Figure 32c,d), the simulated , , , and are 600 V, 1.0 A, 330 V, and 2.0 A; and the measured , , , and are 608 V, 0.9 A, 325 V, and 2.18 A. The simulated and measured input powers () of the dc–ac inverter for the 220 VAC single-phase power supply at full load are 0.6 kW and 0.58 kW.
4.3.4. Maximum Input Power Consumption of the Auxiliary Power Supply System
The total input-power consumption () of the proposed APS system are the summation of the input power of inverter modules 1–5 (, , , , and ) under the full-load condition. Table 5 presents the simulated and measured maximum input current () and input power () of the dc–ac inverters (modules 1–5) of the proposed APS system under the full-load condition.
Figure 33 shows the measured total input current of modules 1–4 (++ +) under variable-load torques (25–100%) and output frequencies (10–50 Hz), given the overhead contact line voltage () of 600 V. The measured total input current of the dc–ac inverters for the compressor motors and air pump motors (modules 1–4; + + + ) under full-load condition (100% load torque and 50 Hz) is 104.6 A. The simulated + + + is 102 A.
Figure 34 shows the measured total input power of modules 1–4 ( + + + ) under variable load torques (25–100%) and output frequencies (10–50 Hz), given the overhead contact line voltage () of 600 V. The measured total input power of the dc–ac inverters for the compressor motors and air pump motors (modules 1–4; + + + ) under the full-load condition is 62.96 kW. The simulated PDC1 + PDC2 + PDC3 + PDC4 is 61.2 kW.
Figure 35 shows the measured total input current of modules 1–5 () under variable load torques (25–100%) and output frequencies (10–50 Hz), given the overhead contact line voltage () of 600 V. The measured total input current of modules 1–5 () under the full-load condition is 114.36 A. The simulated is 112 A.
Figure 36 shows the measured total input power of modules 1–5 () under variable load torques (25–100%) and output frequencies (10–50 Hz), given the overhead contact line voltage () of 600 V. The measured total input power of modules 1–5 () under the full-load condition is 68.84 kW. The simulated is 67.20 kW.
4.4. Efficiency of the Proposed APS System
To assess the efficiency of the proposed APS system, the input power () and output power () of five parallel-connected dc–ac inverters (modules 1–5) of the proposed APS system are measured by the power meter WT330 under full-load operation. Table 6 presents the experimental results of five parallel-connected dc–ac inverters under full-load operation.
The efficiency of the three-phase dc–ac inverters for the compressor motors (modules 1–2; –) is 98.04%, and the efficiency of the three-phase dc–ac inverters for the air pump motors (modules 3–4; –) is 95.07%. The efficiency of the single-phase dc–ac inverter (module 5; ) is 95.19%. THDv and THDi of the single-phase dc–ac inverter are 9.062% and 13.4%, respectively, due to the output low-pass filter. The total efficiency of the proposed APS system (modules 1–5; ) is 97.05%.
4.5. Application of the Proposed APS System in Low-Floor Light Rail Vehicle
The proposed APS system is installed on the rooftop of the low-floor LRV, as shown in Figure 37. The low-floor LRV with a roof-mounted APS system was test-run on the test track, as depicted in Figure 38. The LRV is to be officially launched and in service by June 2023 in Thailand’s northeastern province of Khon Kaen (i.e., a second-tier city), located 450 km northeast of the capital Bangkok.
5. Conclusions and Future Research
This research proposes a roof-mounted APS system for 600 VDC low-floor LRVs. The proposed APS system consists of five parallel-connected inverter modules (modules 1–5). Inverter modules 1 and 2 are the three-phase dc–ac inverters for the compressor motors of the air conditioning system, and modules 3 and 4 are the three-phase dc–ac inverters for the air pump motors of the air supply system. Inverter module 5 is the single-phase dc–ac inverter for the 220 VAC power supply for onboard electric loads, including lighting, fans, electric doors, and the 24 VDC battery charging system. The v/f control method is used to vary the speed of the three-phase compressor motors of the air conditioning system (modules 1 and 2) and the three-phase air pump motors of the air supply system (modules 3 and 4). The magnitude control is applied to module 5 for 220 VAC output voltage and 50 Hz output frequency. Simulations and experiments are carried out under variable load torques (25–100%) and output frequencies (10–50 Hz) for modules 1–4; and under full resistive load and no resistive load for inverter module 5. The measured total input current () and total input power () of the proposed APS system under the full-load condition are 114.36 A and 68.84 kW, respectively. The total efficiency of the proposed APS system (modules 1–5) is 97.05%. The experimental results indicate that the proposed APS system is suitable for the 600 VDC low-floor RLV. Future research could focus on the design and development of the electric traction system of the 600 VDC low-floor LRV. The total input power of the proposed APS system (in this research) and the electric traction system (in the future research) is further used to design and develop the traction substations of the low-floor LRV.
Author Contributions
Conceptualization, P.K. and K.C.; methodology, P.K., K.C. and S.K.; software, P.K.; validation, P.K., K.C. and S.K.; formal analysis, P.K.; investigation, K.C.; resources, S.K.; data curation, P.K.; writing—original draft preparation, P.K., K.C. and S.K.; writing—review and editing, P.K., K.C. and S.K.; visualization, P.K., K.C. and S.K.; project administration, P.K., K.C. and S.K.; funding acquisition, P.K. and K.C. All authors have read and agreed to the published version of the manuscript.
Funding
This research was funded by the Program Management Unit for Competitiveness (PMUC), the Office of National Higher Education Science Research and Innovation Policy Council, Ministry of Higher Education, Science, Research and Innovation, Thailand, under grants no. C10F630062, C10F640250, and C10F650144.
Data Availability Statement
The data presented in this study are available on request from the corresponding author.
Conflicts of Interest
The authors declare no conflict of interest.
References
- Fang, Y.; Jiang, Y.; Fei, W. Disruption Recovery for Urban Public Tram System: An Analysis of Replacement Service Selection. IEEE Access 2020, 8, 31633–31646. [Google Scholar] [CrossRef]
- Guerrieri, M. Tramways in Urban Areas: An Overview on Safety at Road Intersections. Urban Rail Transit 2018, 4, 223–233. [Google Scholar] [CrossRef] [Green Version]
- Swanson, J.D.; Thornes, C. Light-Rail Transit Systems. IEEE Veh. Technol. Mag. 2010, 5, 22–27. [Google Scholar] [CrossRef]
- Glickenstein, H. Extension of the hudson bergen light rail. IEEE Veh. Technol. Mag. 2006, 1, 40–43. [Google Scholar] [CrossRef]
- Chan, H.Y.; Chen, A.; Li, G.; Xu, X.; Lam, W. Evaluating the value of new metro lines using route diversity measures: The case of Hong Kong’s Mass Transit Railway system. J. Transp. Geogr. 2020, 91, 102945. [Google Scholar] [CrossRef]
- Gunduz, M.; Ugur, L.O.; Ozturk, E. Parametric cost estimation system for light rail transit and metro trackworks. Expert Syst. Appl. 2011, 38, 2873–2877. [Google Scholar] [CrossRef]
- Song, H.; Schnieder, E. Development and Validation of a Distance Measurement System in Metro Lines. IEEE Trans. Intell. Transp. Syst. 2018, 20, 441–456. [Google Scholar] [CrossRef]
- Yang, X.; Ning, B.; Li, X.; Tang, T. A two-objective timetable optimization model in subway systems. IEEE Trans. Intell. Transp. Syst. 2014, 15, 1913–1921. [Google Scholar] [CrossRef]
- Dolgushin, A.S.; Ganshin, A.A.; Meleshin, V.I.; Zhiklenkov, D.V. Auxiliary Large Power Converter Supplying with 2.1... 4.7 kV DC Contact Line for Russian Railways. In Proceedings of the 2018 20th European Conference on Power Electronics and Applications (EPE’18 ECCE Europe), Riga, Latvia, 17–21 September 2018. [Google Scholar]
- Rufer, A.; Schibli, N.; Chabert, C.; Zimmermann, C. Configurable front-end converters for multicurrent locomotives operated on 16 2/3 Hz AC and 3 kV DC systems. IEEE Trans. Power Electron. 2003, 18, 1186–1193. [Google Scholar] [CrossRef]
- Vinnikov, D.; Laugis, J.; Jalakas, T. Development of auxiliary power supplies for the 3.0 kV DC rolling stock. In Proceedings of the 2007 IEEE International Symposium on Industrial Electronics, Vigo, Spain, 4–7 June 2007. [Google Scholar] [CrossRef]
- Deblecker, O.; Moretti, A.; Vallee, F. Comparative study of soft-switched isolated dc-dc converters for auxiliary railway supply. IEEE Trans. Power Electron. 2008, 23, 2218–2229. [Google Scholar] [CrossRef]
- Vinnikov, D.; Laugis, J. High voltage auxiliary power supply with the simplified power circuit topology for the DC trains. In Proceedings of the 2007 9th International Conference on Electrical Power Quality and Utilisation, Barcelona, Spain, 9–11 October 2007. [Google Scholar] [CrossRef]
- Vos, P.G.E. The Auxiliary Power Supply System for Double Deck Trains. In Proceedings of the IEEE Colloquium on Auxiliary Power Supplied for Rolling Stock, London, UK, 24 February 1992. [Google Scholar]
- Baars, N.H.; Everts, J.; Huisman, H.; Duarte, J.L.; Lomonova, E.A. A 80-kW Isolated DC-DC Converter for Railway Applications. IEEE Trans. Power Electron. 2015, 30, 6639–6647. [Google Scholar] [CrossRef]
- Mishima, T.; Koji, Y. Zero voltage soft-switching phase-shift PWM controlled three-level DC-DC converter for railway auxiliary electric power unit. In Proceedings of the 2019 IEEE Applied Power Electronics Conference and Exposition (APEC), Anaheim, CA, USA, 17–21 March 2019. [Google Scholar] [CrossRef]
- Ocklenburg, M.A.; Dohmen, M.; Wu, X.Q.; Helsper, M. Next generation DC-DC converters for Auxiliary Power Supplies with SiC MOSFETs. In Proceedings of the 2018 IEEE International Conference on Electrical Systems for Aircraft, Railway, Ship Propulsion and Road Vehicles & International Transportation Electrification Conference (ESARS-ITEC), Nottingham, UK, 7–9 November 2018. [Google Scholar] [CrossRef]
- Helsper, M.; Ocklenburg, M.A. SiC MOSFET based auxiliary power supply for rail vehicles. In Proceedings of the 2018 20th European Conference on Power Electronics and Applications (EPE’18 ECCE Europe), Riga, Latvia, 17–21 September 2018. [Google Scholar]
- Ocklenburg, M.A.; Helsper, M.; Siemer, H.; Gusek, A. Potentials and requirements of silicon carbide hybrid power modules for railway onboard auxiliary power supplies. In Proceedings of the International Exhibition and Conference for Power Electronics, Intelligent Motion, Renewable Energy and Energy Management (PCIM Europe 2014), Nuremberg, Germany, 20–22 May 2014. [Google Scholar]
- März, A.; Bakran, M.M. Designing a low weight low loss auxiliary converter for railway application. In Proceedings of the International Exhibition and Conference for Power Electronics, Intelligent Motion, Renewable Energy and Energy Management (PCIM Europe 2014), Nuremberg, Germany, 20–22 May 2014. [Google Scholar]
- Cobanov, N.; Tezak, N. Soft-switching converter for tram auxiliary power supply. In Proceedings of the 2014 16th International Power Electronics and Motion Control Conference and Exposition, Antalya, Turkey, 21–24 September 2014. [Google Scholar] [CrossRef]
- Martinez, C.; Vazquez, R.; Quesada, I.; Lucena, C.; Lazaro, A.; Barrado, A. PWM-VSI overmodulation technique with carrier harmonics reduction for auxiliary railway power supply. In Proceedings of the 2011 7th International Conference-Workshop Compatibility and Power Electronics (CPE), Tallinn, Estonia, 1–3 June 2011. [Google Scholar] [CrossRef]
- Nguyen, P.; Gerth, A. Softswitching with SiC-devices for compact onboard railway power supplies. In Proceedings of the 2012 15th International Power Electronics and Motion Control Conference (EPE/PEMC), Novi Sad, Serbia, 4–6 September 2012. [Google Scholar] [CrossRef]
- Zhu, W.; Luo, D.; Shu, Z. Bidirectional Dual-active DC-DC Converter Based on Traction Auxiliary Power Supply System. In Proceedings of the 2019 IEEE 4th International Future Energy Electronics Conference (IFEEC), Singapore, 25–28 November 2019. [Google Scholar] [CrossRef]
- Pons, E.; Tommasini, R.; Colella, P. Fault current detection and dangerous voltages in DC urban rail traction systems. IEEE Trans. Ind. Appl. 2017, 53, 4109–4115. [Google Scholar] [CrossRef] [Green Version]
- Polater, N.; Tricoli, P. Technical Review of Traction Drive Systems for Light Railways. Energies 2022, 15, 3187. [Google Scholar] [CrossRef]
- Yıldırım, D.; Akşit, M.H.; Çadırcı, I.; Ermiş, M. All-SiC Traction Converter for Light Rail Transportation Systems: Design Methodology and Development of 165 kVA Prototype. Electronics 2022, 11, 1438. [Google Scholar] [CrossRef]
- Calleja, C.; Lopez-De-Heredia, A.; Gaztanaga, H.; Aldasoro, L.; Nieva, T. Validation of a Modified Direct-Self-Control Strategy for PMSM in Railway-Traction Applications. IEEE Trans. Ind. Electron. 2016, 63, 5143–5155. [Google Scholar] [CrossRef]
- Youssef, M.Z.; Woronowicz, K.; Aditya, K.; Azeez, N.A.; Williamson, S.S. Design and development of an efficient multilevel DC/AC traction inverter for railway transportation electrification. IEEE Trans. Power Electron. 2016, 31, 3036–3042. [Google Scholar] [CrossRef]
- Zhang, B.; Yang, P.; Ge, Q.; Wang, X.; Li, Y. A New High Output Frequency Multilevel Inverter Topology of Traction Converter for Superspeed Maglev Train. In Proceedings of the 2021 13th International Symposium on Linear Drives for Industry Applicaitions (LDIA), Wuhan, China, 1–3 July 2021. [Google Scholar] [CrossRef]
- Li, K.; Cheng, S.; Yu, T.; Wu, X.; Xiang, C.; Bilal, A. An On-Line Multiple Open-Circuit Fault Diagnostic Technique for Railway Vehicle Air-Conditioning Inverters. IEEE Trans. Veh. Technol. 2020, 69, 7026–7039. [Google Scholar] [CrossRef]
- Poorfakhraei, A.; Narimani, M.; Emadi, A. A review of multilevel inverter topologies in electric vehicles: Current status and future trends. IEEE Open J. Power Electron. 2021, 2, 155–170. [Google Scholar] [CrossRef]
- Pangestu, R.; Harini, B.W.; Yusivar, I.F. Temperature Control of Air Conditioning Compressor System on Electric Vehicles. In Proceedings of the 2019 IEEE Conference on Energy Conversion (CENCON), Yogyakarta, Indonesia, 16–17 October 2019. [Google Scholar] [CrossRef]
- Tehrani, K.; Weber, M.; Rasoanarivo, I. Hybrid Power System Optimization for Microgrids. In Proceedings of the 2021 23rd European Conference on Power Electronics and Applications (EPE’21 ECCE Europe), Ghent, Belgium, 6–10 September 2021. [Google Scholar] [CrossRef]
- Rasoanarivo, I.; Tehrani, K.; Scalcon, F.P.; Nahid-Mobarakeh, B. A Dual Multilevel Adaptive Converter for Microgrid Applications. In Proceedings of the 48th Annual Conference of the IEEE Industrial Electronics Society (IECON 2022), Brussels, Belgium, 17–20 October 2022. [Google Scholar] [CrossRef]
- Yi, J.; Li, C.; Zhang, D.; Li, X.; Jiang, M.; Zhao, H.; Zhang, Y.; Wu, X. A Fast and Accurate Loss Model of Converter-Fed Induction Motor in Central Air-Conditioning System. IEEE Trans. Power Electron. 2023, 38, 3689–3699. [Google Scholar] [CrossRef]
- Reisinger, M.; Amrhein, W.; Silber, S. Single phase PWM controlled voltage converter for pumps and fans without DC link electrolytic capacitors. In Proceedings of the 2005 International Conference on Power Electronics and Drives Systems, Kuala Lumper, Malaysia, 28 November–1 December 2005. [Google Scholar] [CrossRef]
Figure 1.
The early APS system with three-phase output transformer for dc trains.

Figure 2.
The isolated dc–dc converter with high-frequency transformer of the conventional APS system for dc trains.
Figure 2.
The isolated dc–dc converter with high-frequency transformer of the conventional APS system for dc trains.

Figure 3.
The proposed APS system for 600 VDC low-floor light rail vehicles.

Figure 4.
The design of the low-floor LRV for the Khon Kaen light rail transit project.

Figure 5.
The 600 VDC overhead contact line for the proposed APS system of the low-floor LRV.

Figure 6.
Connecting diagram of the proposed APS system and onboard electric loads on the low-floor LRV.
Figure 6.
Connecting diagram of the proposed APS system and onboard electric loads on the low-floor LRV.

Figure 7.
The schematic of temperature control in the passenger room of the LRV.

Figure 8.
The schematic of air pressure control of the air supply system of the LRV.

Figure 9.
Relationship between torque and speed of the VVVF control method of the compressor and air pump motors: (a) torque and speed; (b) stator voltage and frequency.
Figure 9.
Relationship between torque and speed of the VVVF control method of the compressor and air pump motors: (a) torque and speed; (b) stator voltage and frequency.

Figure 10.
Topology of three-phase two-level dc–ac inverter, the direction of phase currents (, , ), and IGBT switches’ status in voltage vectors ( -).
Figure 10.
Topology of three-phase two-level dc–ac inverter, the direction of phase currents (, , ), and IGBT switches’ status in voltage vectors ( -).

Figure 11.
The switching vectors for three-phase two-level dc–ac inverter (vectors –).

Figure 12.
Schematic of three-phase dc–ac inverters and control diagram of the compressor motors of the APS system.
Figure 12.
Schematic of three-phase dc–ac inverters and control diagram of the compressor motors of the APS system.

Figure 13.
Schematic of three-phase dc–ac inverters and control diagram of the air pump motors of the APS system.
Figure 13.
Schematic of three-phase dc–ac inverters and control diagram of the air pump motors of the APS system.

Figure 14.
Magnitude-control diagram of the single-phase power supply of the proposed APS system.

Figure 15.
The schematic of the proposed APS system for the low-floor LRV.

Figure 16.
The proposed APS system for low-floor LRV consisting of five inverter modules; (a) 3D model; (b) APS system prototype.
Figure 16.
The proposed APS system for low-floor LRV consisting of five inverter modules; (a) 3D model; (b) APS system prototype.

Figure 17.
The proposed APS system for low-floor LRV with metal castings and electrical enclosures as per IP65 code: (a) 3D model; (b) APS system prototype with metal castings.
Figure 17.
The proposed APS system for low-floor LRV with metal castings and electrical enclosures as per IP65 code: (a) 3D model; (b) APS system prototype with metal castings.

Figure 18.
The experimental setup of the proposed APS system: (a) 600 VDC power supply, APS system, resistive load, and 24 VDC battery; (b) simulated loads #1–#4.
Figure 18.
The experimental setup of the proposed APS system: (a) 600 VDC power supply, APS system, resistive load, and 24 VDC battery; (b) simulated loads #1–#4.

Figure 19.
The schematic of the proposed APS system with the simulated loads.

Figure 20.
The waveforms of the three-phase dc–ac inverters for the compressor motors (modules 1 and 2): (a) simulated , , , and ; (b) simulated , , , and ; (c) measured , , , and ; (d) measured , , , and ; given that = 600 V, = 50 Hz, and load torque = 100%.
Figure 20.
The waveforms of the three-phase dc–ac inverters for the compressor motors (modules 1 and 2): (a) simulated , , , and ; (b) simulated , , , and ; (c) measured , , , and ; (d) measured , , , and ; given that = 600 V, = 50 Hz, and load torque = 100%.

Figure 21.
The waveforms of the three-phase dc–ac inverters for the compressor motors (modules 1 and 2): (a) simulated , , , and ; (b) simulated , , , and ; (c) measured , , , and ; (d) measured , , , and ; given that = 600 V, = 50 Hz, and load torque = 75%.
Figure 21.
The waveforms of the three-phase dc–ac inverters for the compressor motors (modules 1 and 2): (a) simulated , , , and ; (b) simulated , , , and ; (c) measured , , , and ; (d) measured , , , and ; given that = 600 V, = 50 Hz, and load torque = 75%.


Figure 22.
The waveforms of the three-phase dc–ac inverters for the compressor motors (modules 1 and 2): (a) simulated , , , and ; (b) simulated , , , and ; (c) measured , , , and ; (d) measured , , , and ; given that = 600 V, = 50 Hz, and load torque = 50%.
Figure 22.
The waveforms of the three-phase dc–ac inverters for the compressor motors (modules 1 and 2): (a) simulated , , , and ; (b) simulated , , , and ; (c) measured , , , and ; (d) measured , , , and ; given that = 600 V, = 50 Hz, and load torque = 50%.

Figure 23.
The waveforms of the three-phase dc–ac inverters for the compressor motors (modules 1 and 2): (a) simulated , , , and ; (b) simulated , , , and ; (c) measured , , , and ; (d) measured , , , and ; given that = 600 V, = 50 Hz, and load torque = 25%.
Figure 23.
The waveforms of the three-phase dc–ac inverters for the compressor motors (modules 1 and 2): (a) simulated , , , and ; (b) simulated , , , and ; (c) measured , , , and ; (d) measured , , , and ; given that = 600 V, = 50 Hz, and load torque = 25%.

Figure 24.
The measured results of the three-phase dc–ac inverter for the compressor motors (i.e., module 1) under variable load torques (25–100%) and output frequencies (10–50 Hz): (a) dc input current (); (b) dc input power ( ).
Figure 24.
The measured results of the three-phase dc–ac inverter for the compressor motors (i.e., module 1) under variable load torques (25–100%) and output frequencies (10–50 Hz): (a) dc input current (); (b) dc input power ( ).

Figure 25.
The measured results of the three-phase dc–ac inverter for the compressor motors (i.e., modules 1 and 2) under variable load torques (25–100%) and output frequencies (10–50 Hz): (a) dc input current ( + ); (b) dc input power ( + ).
Figure 25.
The measured results of the three-phase dc–ac inverter for the compressor motors (i.e., modules 1 and 2) under variable load torques (25–100%) and output frequencies (10–50 Hz): (a) dc input current ( + ); (b) dc input power ( + ).

Figure 26.
The waveforms of the three-phase dc–ac inverter for the air pump motors (modules 3 and 4): (a) simulated , , , and ; (b) simulated , , , and ; (c) measured , , , and ; (d) measured , , , and ; given that = 600 V, = 50 Hz, and load torque = 100%.
Figure 26.
The waveforms of the three-phase dc–ac inverter for the air pump motors (modules 3 and 4): (a) simulated , , , and ; (b) simulated , , , and ; (c) measured , , , and ; (d) measured , , , and ; given that = 600 V, = 50 Hz, and load torque = 100%.

Figure 27.
The waveforms of the three-phase dc–ac inverter for the air pump motors (modules 3 and 4): (a) simulated , , , and ; (b) simulated , , , and ; (c) measured , , , and ; (d) measured , , , and ; given that = 600 V, = 50 Hz, and load torque = 75%.
Figure 27.
The waveforms of the three-phase dc–ac inverter for the air pump motors (modules 3 and 4): (a) simulated , , , and ; (b) simulated , , , and ; (c) measured , , , and ; (d) measured , , , and ; given that = 600 V, = 50 Hz, and load torque = 75%.

Figure 28.
The waveforms of the three-phase dc–ac inverter for the air pump motors (modules 3 and 4): (a) simulated , , , and ; (b) simulated , , , and ; (c) measured , , , and ; (d) measured , , , and ; given that = 600 V, = 50 Hz, and load torque = 50%.
Figure 28.
The waveforms of the three-phase dc–ac inverter for the air pump motors (modules 3 and 4): (a) simulated , , , and ; (b) simulated , , , and ; (c) measured , , , and ; (d) measured , , , and ; given that = 600 V, = 50 Hz, and load torque = 50%.

Figure 29.
The waveforms of the three-phase dc–ac inverter for the air pump motors (modules 3 and 4): (a) simulated , , , and ; (b) simulated , , , and ; (c) measured , , , and ; (d) measured , , , and ; given that = 600 V, = 50 Hz, and load torque = 25%.
Figure 29.
The waveforms of the three-phase dc–ac inverter for the air pump motors (modules 3 and 4): (a) simulated , , , and ; (b) simulated , , , and ; (c) measured , , , and ; (d) measured , , , and ; given that = 600 V, = 50 Hz, and load torque = 25%.

Figure 30.
The measured results of the three-phase dc–ac inverter for the air pump motors (i.e., module 3) under variable load torques (25–100%) and output frequencies (10–50 Hz): (a) dc input current (); (b) dc input power ( ).
Figure 30.
The measured results of the three-phase dc–ac inverter for the air pump motors (i.e., module 3) under variable load torques (25–100%) and output frequencies (10–50 Hz): (a) dc input current (); (b) dc input power ( ).

Figure 31.
The measured results of the three-phase dc–ac inverter for the air pump motors (i.e., modules 3 and 4) under variable load torques (25–100%) and output frequencies (10–50 Hz): (a) dc input current (+ ); (b) dc input power ( + ).
Figure 31.
The measured results of the three-phase dc–ac inverter for the air pump motors (i.e., modules 3 and 4) under variable load torques (25–100%) and output frequencies (10–50 Hz): (a) dc input current (+ ); (b) dc input power ( + ).

Figure 32.
The , , , and waveforms of the dc–ac inverter for the single-phase power supply (module 5) given that = 600 VDC and = 50 Hz: (a) full load (simulated; resistive load = 100%); (b) full load (measured); (c) no load (simulated; resistive load = 0%); and (d) no load (measured).
Figure 32.
The , , , and waveforms of the dc–ac inverter for the single-phase power supply (module 5) given that = 600 VDC and = 50 Hz: (a) full load (simulated; resistive load = 100%); (b) full load (measured); (c) no load (simulated; resistive load = 0%); and (d) no load (measured).

Figure 33.
The measured total input current of the dc–ac inverters for compressor motors and air pump motors (modules 1–4; - ) under variable load torques (25–100%) and output frequencies (10–50 Hz), given the overhead contact line voltage ( ) of 600 V.
Figure 33.
The measured total input current of the dc–ac inverters for compressor motors and air pump motors (modules 1–4; - ) under variable load torques (25–100%) and output frequencies (10–50 Hz), given the overhead contact line voltage ( ) of 600 V.

Figure 34.
The measured total input power of the dc–ac inverters for compressor motors and air pump motors (modules 1–4; - ) under variable load torques (25–100%) and output frequencies (10–50 Hz), given the overhead contact line voltage ( ) of 600 V.
Figure 34.
The measured total input power of the dc–ac inverters for compressor motors and air pump motors (modules 1–4; - ) under variable load torques (25–100%) and output frequencies (10–50 Hz), given the overhead contact line voltage ( ) of 600 V.

Figure 35.
The measured total input current of the dc–ac inverters modules 1–5 () under variable load torques (25–100%) and output frequencies (10–50 Hz) for modules 1–4 and a resistive load of 100% and output frequency of 50 Hz for module 5, given the overhead contact line voltage ( ) of 600 V.
Figure 35.
The measured total input current of the dc–ac inverters modules 1–5 () under variable load torques (25–100%) and output frequencies (10–50 Hz) for modules 1–4 and a resistive load of 100% and output frequency of 50 Hz for module 5, given the overhead contact line voltage ( ) of 600 V.

Figure 36.
The measured total input power of the dc–ac inverters modules 1–5 () under variable load torques (25–100%) and output frequencies (10–50 Hz) for modules 1–4 and a resistive load of 100% and output frequency of 50 Hz for module 5, given the overhead contact line voltage ( ) of 600 V.
Figure 36.
The measured total input power of the dc–ac inverters modules 1–5 () under variable load torques (25–100%) and output frequencies (10–50 Hz) for modules 1–4 and a resistive load of 100% and output frequency of 50 Hz for module 5, given the overhead contact line voltage ( ) of 600 V.

Figure 37.
The 600 VDC low-floor LRV with the proposed APS system mounted on the rooftop of car no. 2.
Figure 37.
The 600 VDC low-floor LRV with the proposed APS system mounted on the rooftop of car no. 2.

Figure 38.
Low-floor light rail vehicle with the roof-mounted APS system.


Table 1.
The specifications of the low-floor LRV for Khon Kaen light rail transit project.
| Low-Floor Light Rail Vehicle Specifications | |
|---|---|
| Vehicle type | Low-Floor LRV |
| Vehicle configuration | 2 cars/3 cars |
| Axial load | 5 tons |
| Track gauge | 1435 mm |
| Overhead contact line voltage | 600 VDC |
| Vehicle length | 20,350 mm |
| Vehicle width | 2540 mm |
| Vehicle height | 3580 mm |
| Wheel diameters | 600/520 mm (new/worn) |
| Maximum speed | 80 km/h |
| Design speed | 50 km/h |
| Traction inverter power rating | 4 × 100 kW |
| Traction motor type | PMSM |
| Traction motor power rating | 4 × 90 kW |
| Number of passenger (4 persons/m2) | 80 persons/120 persons |
| Total weight (Empty weight) | 35 tons (approximated) |
Table 2.
The specifications of onboard electric loads of low-floor LRV.
| Onboard Electric Loads of Low-Floor Light Rail Vehicle | ||
|---|---|---|
| Air conditioning (2 sets) | Cooling capacity | 150,000 btu |
| Input voltage | 3-phase 380–400 Vrms AC | |
| Input frequency | 50 Hz | |
| Compressor type | Scroll Type, 3-phase induction motor | |
| Rated power | 20 kW | |
| Rated current | 40 Arms | |
| Air pumps (2 sets) | Input voltage | 3-phase 380–400 Vrms AC |
| Input frequency | 50 Hz | |
| Motor type | 3-phase induction motor | |
| Rated power | 10 kW | |
| Rated current | 14.4 Arms | |
| Fans | Input voltage | 1-phase 220 Vrms AC |
| Input frequency | 50 Hz | |
| Lighting | Input voltage | 1-phase 220 Vrms AC |
| Input frequency | 50 Hz | |
| Electric doors | Input voltage | 1-phase 220 Vrms AC |
| Input frequency | 50 Hz | |
| Battery charging system | Input voltage | 1-phase 220 Vrms AC |
| Input frequency | 50 Hz | |
| Output voltage | 24 VDC | |
Table 3.
The relationship between modulation index and line-to-line voltage of the three-phase two-level dc–ac inverter of the proposed APS system.
Table 3.
The relationship between modulation index and line-to-line voltage of the three-phase two-level dc–ac inverter of the proposed APS system.
| Modulation Index | ||||
|---|---|---|---|---|
| 0 | 600 | 0 | 0 | 0 |
| 0.1 | 600 | 42.18 | 42.18 | 42.18 |
| 0.2 | 600 | 84.75 | 84.75 | 84.75 |
| 0.3 | 600 | 127.2 | 127.2 | 127.2 |
| 0.4 | 600 | 169.3 | 169.3 | 169.3 |
| 0.5 | 600 | 212.3 | 212.3 | 212.3 |
| 0.6 | 600 | 253.2 | 253.2 | 253.2 |
| 0.7 | 600 | 297.0 | 297.0 | 297.0 |
| 0.8 | 600 | 338.9 | 338.9 | 338.9 |
| 0.9 | 600 | 381.6 | 381.6 | 381.6 |
| 1.0 | 600 | 424.1 | 424.1 | 424.1 |
Table 4.
The specifications of onboard electric loads on the low-floor LRV.
| Onboard Electric Loads | Details | |
|---|---|---|
| Compressor motors | Load type | 3-phase induction motor |
| Output voltage | 0–400 V | |
| Output frequency | 0–50 Hz | |
| Rated power | 20 kW | |
| Air pump motors | Load type | 3-phase induction motor |
| Output voltage | 0–400 V | |
| Output frequency | 0–50 Hz | |
| Rated power | 10 kW | |
| Lighting, | Load type | 1-phase |
| fans, | Output voltage | 220 V |
| electric doors, | Output frequency | 50 Hz |
| and battery charging system | Rated power | 5.5 kW |
Table 5.
The simulated and measured maximum input current and input power of the dc–ac inverters (modules 1–5) of the APS system under full-load condition, given the overhead contact line voltage ( ) of 600 V.
Table 5.
The simulated and measured maximum input current and input power of the dc–ac inverters (modules 1–5) of the APS system under full-load condition, given the overhead contact line voltage ( ) of 600 V.
| Onboard Electric Loads | Details | Measured | Simulated | % Error |
|---|---|---|---|---|
| Compressor motors | 37.9 A | 37 A | 2.37 | |
| (2 units; modules 1 and2) | 22.81 kW | 22.2 kW | 2.67 | |
| 37.9 A | 37 A | 2.37 | ||
| 22.81 kW | 22.2 kW | 2.67 | ||
| Air pump motors | 14.4 A | 14 A | 2.77 | |
| (2 units; modules 3 and 4) | 8.67 kW | 8.4 kW | 3.11 | |
| 14.4 A | 14 A | 2.77 | ||
| 8.67 kW | 8.4 kW | 3.11 | ||
| Resistive load | 9.76 A | 10 A | 2.45 | |
| (Module 5) | 5.87 kW | 6.0 kW | 2.56 |
Table 6.
The measured results of input power, output power, power loss, and efficiency of the dc–ac inverters (modules 1–5) of the APS system under full-load operation, given the overhead contact line voltage ( ) of 600 V.
Table 6.
The measured results of input power, output power, power loss, and efficiency of the dc–ac inverters (modules 1–5) of the APS system under full-load operation, given the overhead contact line voltage ( ) of 600 V.
| DC–AC Inverters | Value | DC Input | AC Output | Unit |
|---|---|---|---|---|
| Compressor motors | V(rms) | 602.0 | 380.76 | V |
| (2 units; modules 1 and 2) | I(rms) | 37.9 | 39.9 | A |
| Frequency | - | 50 | Hz | |
| Active Power (P) | 22.815 | 22.366 | kW | |
| PF | - | 0.85 | - | |
| Power Loss | 449 | W | ||
| ) | 98.04 | % | ||
| Air pump motors | V(rms) | 602.0 | 380.75 | V |
| (2 units; modules 3 and 4) | I(rms) | 14.4 | 14.2 | A |
| Frequency | - | 50 | Hz | |
| Active Power (P) | 8.668 | 8.240 | kW | |
| PF | - | 0.88 | - | |
| Power Loss | 428 | W | ||
| ) | 95.07 | % | ||
| Resistive load | V(rms) | 602.0 | 222.11 | V |
| (module 5) | I(rms) | 9.76 | 25.18 | A |
| Frequency | - | 50 | Hz | |
| Active Power (P) | 5.875 | 5.592 | kW | |
| PF | - | 1.00 | - | |
| Power Loss | 283 | W | ||
| ) | 95.19 | % | ||
| THDv | 9.062 | % | ||
| THDi | 13.4 | % | ||
| DC–AC inverters (modules 1–5) | Active Power (P) | 68.841 | 66.804 | kW |
| ) | 97.05 | % |
Disclaimer/Publisher’s Note: The statements, opinions and data contained in all publications are solely those of the individual author(s) and contributor(s) and not of MDPI and/or the editor(s). MDPI and/or the editor(s) disclaim responsibility for any injury to people or property resulting from any ideas, methods, instructions or products referred to in the content. |
© 2023 by the authors. Licensee MDPI, Basel, Switzerland. This article is an open access article distributed under the terms and conditions of the Creative Commons Attribution (CC BY) license (https://creativecommons.org/licenses/by/4.0/).
Share and Cite
MDPI and ACS Style
Kerdtuad, P.; Chaiamarit, K.; Kittiratsatcha, S. Auxiliary Power Supply System with Parallel-Connected DC–AC Inverters for Low-Floor Light Rail Vehicle. Electronics 2023, 12, 3117. https://doi.org/10.3390/electronics12143117
AMA Style
Kerdtuad P, Chaiamarit K, Kittiratsatcha S. Auxiliary Power Supply System with Parallel-Connected DC–AC Inverters for Low-Floor Light Rail Vehicle. Electronics. 2023; 12(14):3117. https://doi.org/10.3390/electronics12143117
Chicago/Turabian StyleKerdtuad, Paiwan, Kunjana Chaiamarit, and Supat Kittiratsatcha. 2023. "Auxiliary Power Supply System with Parallel-Connected DC–AC Inverters for Low-Floor Light Rail Vehicle" Electronics 12, no. 14: 3117. https://doi.org/10.3390/electronics12143117
Note that from the first issue of 2016, this journal uses article numbers instead of page numbers. See further details here.